Tutorial on using the firefox plug-in Firebug_javascript skills
什么是Firebug
从事了数年的Web开发工作,越来越觉得现在对WEB开发有了更高的要求。要写出漂亮的HTML代码;要编写精致的CSS样式表展示每个页面模块;要调试 javascript给页面增加一些更活泼的要素;要使用Ajax给用户带来更好的体验。一个优秀的WEB开发人员需要顾及更多层面,才能交出一份同样优秀的作业。为帮助广大正处于Web2.0洪流中的开发人员,在这里为大家介绍一款轻巧灵活的辅助开发工具。
Firebug是Firefox下的一款开发类插件,现属于Firefox的五星级强力推荐插件之一。它集HTML查看和编辑、 Javascript控制台、网络状况监视器于一体,是开发JavaScript、CSS、HTML和Ajax的得力助手。Firebug如同一把精巧的瑞士军刀,从各个不同的角度剖析Web页面内部的细节层面,给Web开发者带来很大的便利。这是一款让人爱不释手的插件,如果你以前没有接触过它,也许在阅读本文之后,会有一试的欲望。笔者在撰写此文的时候,正逢Firebug发布1.0正式版,这不能不说是种巧合。
应用
Firebug插件虽然功能强大,但是它已经和Firefox浏览器无缝地结合在一起,使用简单直观。如果你担心它会占用太多的系统资源,也可以方便地启用/关闭这个插件,甚至针对特定的站点开启这个插件。
在安装好插件之后,先用Firefox浏览器打开需要测试的页面,然后点击右下方的绿色按钮或使用快捷键F12唤出Firebug插件,它会将当前页面分成上下两个框架,如图1所示。
图1:Firebug插件展开图示

从图1中看到,Firebug有6个主要的Tab按钮,下文将主要介绍介绍这几方面的功能。
Console HTML CSS Script Dom Net
控制台 Html查看器 Css查看器 脚本条时期 Dom查看器 网络状况监视
Console 控制台
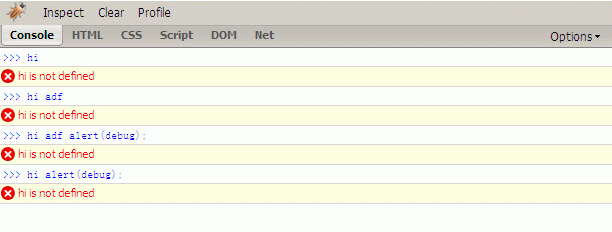
控制台能够显示当前页面中的javascript错误以及警告,并提示出错的文件和行号,方便调试,这些错误提示比起浏览器本身提供的错误提示更加详细且具有参考价值。而且在调试Ajax应用的时候也是特别有用,你能够在控制台里看到每一个XMLHttpRequests请求post出去的参数、 URL,http头以及回馈的内容,原本似乎在幕后黑匣子里运作的程序被清清楚楚地展示在你面前。
象C shell或Python shell一样,你还能在控制台中查看变量内容,直接运行javascript语句,就算是大段的javascript程序也能够正确运行并拿到运行期的信息。
控制台还有个重要的作用就是查看脚本的log, 从前你也许习惯了使用alert来打印变量,但是Firebug给我们带来了一个新朋友 —— console.log, 最简单的打印日志的语法是这样的:
如果你有一堆参数需要组合在一起输出,可以写成这样:
Firebug的日志输出有多种可选的格式以及语法,甚至可以定制彩色输出,比起单调的alert,显然更加方便,限于篇幅,这里不做详细说明,但是有志于提高debug效率的读者,可以到Firebug的官方站点(见附录)查看更详细的教程。
图2: 在控制台里调试javascript
查看和修改HTML
第一次看到Firebug强大的HTML代码查看器,就觉得它与众不同,相比于Firefox自带的HTML查看器,它的功能强大了许多。 HTML
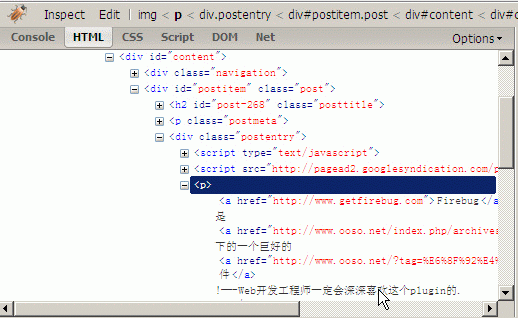
首先你看到的是已经经过格式化的HTML代码,它有清晰的层次,你能够方便地分辨出每一个标签之间的从属并行关系,标签的折叠功能能够帮助你集中精力分析代码。源代码上方还标记出了DOM的层次,如图3所示,它清楚地列出了一个hml元素的parent、child以及root元素,配合 Firebug自带的CSS查看器使用,会给div+css页面分析编写带来很大的好处。你还可以在HTML查看器中直接修改HTML源代码,并在浏览器中第一时间看到修改后的效果,光凭这一点就会让许多页面设计师死心塌地地成为Firebug的粉丝了。
有时候页面中的javascript会根据用户的动作如鼠标的onmouseover来动态改变一些HTML元素的样式表或背景色,HTML查看器会将页面上改变的内容也抓下来,并以黄色高亮标记,让网页的暗箱操作彻底成为历史。
利用Inspect检查功能,我们还可以用鼠标在页面中直接选择一些区块,查看相应的HTML源代码和CSS样式表,真正的做到所见即所得,如果你使用了外部编辑器修改了当前网页,可以点击Firebug的reload图片重新载入网页,它会继续跟踪你之前用Inspect选中的区块,方便调试。
图3::HTML查看器
CSS调试
Firebug的CSS调试器是专为网页设计师们量身定做的。
如今的网页设计言必称div+css,如果你是用table套出来的HTML页面,就得按这规矩重构一遍,否则显得你不够时髦!用div做出来的页面的确能精简HTML代码,HTML标签减肥的结果就是CSS样式表的编写成了页面制作的重头戏。Firebug的CSS查看器不仅自下向上列出每一个 CSS样式表的从属继承关系,还列出了每一个样式在哪个样式文件中定义。你可以在这个查看器中直接添加、修改、删除一些CSS样式表属性,并在当前页面中直接看到修改后的结果。
一个典型的应用就是页面中的一个区块位置显得有些不太恰当,它需要挪动几个象素。这时候用CSS调试工具可以轻易编辑它的位置——你可以根据需要随意挪动象素。
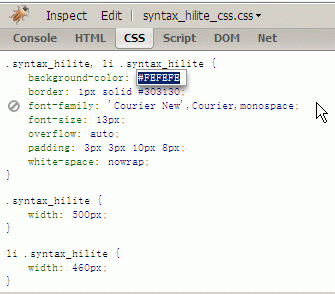
如图4中正在修改一个区块的背景色。
提示:如果你正在学习CSS样式表的应用,但是总记不住常用的样式表有哪些值,可以尝试在CSS调试器中选中一个样式表属性,然后用上下方向键来改变它的值,它会把可能的值一个个遍历给你看。
图4: CSS查看器,能够直接修改样式表
可视化的CSS尺标
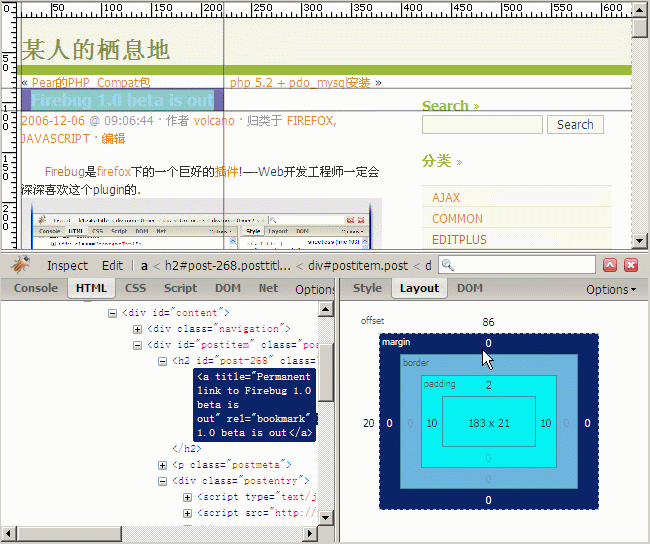
我们可以利用Firebug来查看页面中某一区块的CSS样式表,如果进一步展开右侧Layout tab的话,它会以标尺的形式将当前区块占用的面积清楚地标识出来,精确到象素,更让人惊讶的是,你能够在这个可视化的界面中直接修改各象素的值,页面上区块的位置就会随改动而变化。在页面中某些元素出现错位或者面积超出预料值时,该功能能够提供有效的帮助,你可以籍此分析offset、margin、 padding、size之间的关系,从而找出解决问题的办法。
图5:Firebug中的CSS标尺
Network Status Monitor
Maybe one day, your boss or client comes to you and complains that the web page you created is extremely slow. How should you deal with it? You may say that this may be a network problem, or a computer configuration problem, or the program is too slow, or simply a problem with their character? Regardless, you may end up being asked to solve this problem, which has multiple possibilities.
Network Status Monitor can help you solve this difficult problem. Firebug's network monitor is also powerful. It can display the time it takes to load the CSS, javascript in the page, and the images referenced in the web page in a rectangular chart. Maybe you can find out the slowdown here. Identify the culprit of your web page, and then optimize the web page. Finally, the boss will be satisfied with the customer and your job will be stable.
The network monitor also has some other detailed functions, such as previewing images, viewing each external file and even the http header of the xmlHttpRequests request, etc.
Figure 6: Network Status Monitor
Javascript Debugger
This is a very good javascript script debugger, which does not take up much space, but has a lot of windows for single-step debugging, setting breakpoints, and variable viewing. As the saying goes, although a sparrow is small, it has all five internal organs.
If you have a website that has been built, but its javascript has performance problems or is not perfect, you can use the Profile on the panel to count the running time of each script to see which statements take too long to execute. Troubleshoot the problem step by step.
Figure 7: javascript debugger 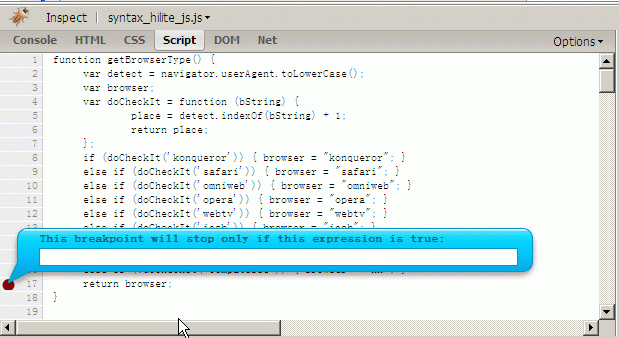
DOM Viewer
DOM (Document Object Model) contains a large number of Objects, functions, and events. In the past, it was not easy to find the content you need. It was like going to a huge library and trying to When it comes to finding a few little books with vaguely named titles, the sheer number of choices can be overwhelming. However, using Firebug's DOM viewer can easily browse the internal structure of the DOM and help you quickly locate DOM objects. Double-click a DOM object to edit its variables or values. While editing, you may find that it also has an auto-complete function. After you enter document.get, press the tab key to complete it to document.getElementById. Very convenient. If you think the completion is not ideal enough, pressing shift tab will restore it to its original state. With Firebug's DOM viewer, your javascript can now find the target to drive, and web development may become a pleasure.
Figure 8: Dom viewer 
Summary
The Firebug plug-in provides a complete set of tools necessary for web development. From writing HTML, to beautifying and tuning CSS style sheets, to developing javascript scripts, or Ajax applications, the Firebug plug-in will be your right-hand assistant. As the saying goes, if a worker wants to do his job well, he must first sharpen his tools. In the era of Web 2.0, Ajax must be said to improve user experience at every turn. If you use the Firebug tool well, you will be even more powerful. You can organize HTML, CSS, and javascript to be perfect, and you will become an expert in web development. level person.

Hot AI Tools

Undresser.AI Undress
AI-powered app for creating realistic nude photos

AI Clothes Remover
Online AI tool for removing clothes from photos.

Undress AI Tool
Undress images for free

Clothoff.io
AI clothes remover

AI Hentai Generator
Generate AI Hentai for free.

Hot Article

Hot Tools

Notepad++7.3.1
Easy-to-use and free code editor

SublimeText3 Chinese version
Chinese version, very easy to use

Zend Studio 13.0.1
Powerful PHP integrated development environment

Dreamweaver CS6
Visual web development tools

SublimeText3 Mac version
God-level code editing software (SublimeText3)

Hot Topics
 1385
1385
 52
52
 How to remove Firefox Snap in Ubuntu Linux?
Feb 21, 2024 pm 07:00 PM
To remove FirefoxSnap in Ubuntu Linux, you can follow these steps: Open a terminal and log in to your Ubuntu system as administrator. Run the following command to uninstall FirefoxSnap: sudosnapremovefirefox You will be prompted for your administrator password. Enter your password and press Enter to confirm. Wait for command execution to complete. Once completed, FirefoxSnap will be completely removed. Note that this will remove versions of Firefox installed via the Snap package manager. If you installed another version of Firefox through other means (such as the APT package manager), you will not be affected. Go through the above steps
 Can mozilla firefox be uninstalled?
Mar 15, 2023 pm 04:40 PM
Mozilla Firefox can be uninstalled; Firefox is a third-party browser and can be uninstalled if it is not needed. Uninstallation method: 1. In the Start menu, click "Windwos System" - "Control Panel"; 2. In the "Control Panel" interface, click "Programs and Features"; 3. In the new interface, find and double-click Firefox Browser icon; 4. In the uninstall pop-up window, click "Next"; 5. Click "Uninstall".
 Firefox 113 new features: support for AV1 animations, enhanced password generator and picture-in-picture features
Mar 05, 2024 pm 05:20 PM
According to recent news, while Mozilla released the stable version of Firefox 112, it also announced that the next major version, Firefox 113, has entered the Beta channel and supports AV1 animations, enhanced password generator and picture-in-picture features. The main new functions/features of Firefox 113 are as follows: Support for AV1 format animated images (AVIS); Enhance the security of the password generator by introducing special characters; Enhance the picture-in-picture function, support rewind, display video time, and enable full screen more easily Mode provides official DEB installation files for Debian and Ubuntu distributions. Updated bookmark import feature, icons for imported bookmarks are supported by default. Hardware accelerated AV1 video decoding is enabled by default on supported hardware using w
 How to use Mozilla Firefox in Scrapy to solve the problem of scanning QR code to log in?
Jun 22, 2023 pm 09:50 PM
For crawlers to crawl websites that require login, verification code or scan code login is a very troublesome problem. Scrapy is a very easy-to-use crawler framework in Python, but when processing verification codes or scanning QR codes to log in, some special measures need to be taken. As a common browser, Mozilla Firefox provides a solution that can help us solve this problem. The core module of Scrapy is twisted, which only supports asynchronous requests, but some websites require the use of cookies and
 Ubuntu 23.10 will run Firefox in native Wayland mode by default
Feb 29, 2024 am 10:10 AM
Canonical recently announced that in the upcoming Ubuntu 23.10, Firefox Snap has been configured to run in Wayland mode by default. Note: Ubuntu currently has the Wayland session by default, and Firefox can also work normally. However, currently FirefoxSnap actually runs in XWayland compatibility mode, rather than the strict native Wayland mode. Canonical announced that it will run the Firefox browser in Wayland mode by default, so that problems such as interface blur and scaling distortion will not occur on HiDPI displays, and it will support touch gestures such as dragging and pinching. As mentioned above, Ubunt
 Firefox browser Firefox 115 released, supports the last version of Win7/Win8.1
Mar 04, 2024 pm 04:46 PM
Today’s latest news, Mozilla officially released the Firefox 115 stable version update today. The most noteworthy thing about this update is that this is the last version that supports Win7/Win8, macOS10.12, 10.13 and 10.14. Download address: https://ftp.mozilla.org/pub/firefox/releases/115.0/Mozilla stated in the official update log: Microsoft will end support for Win7 and Win8 systems in January 2023, and Firefox 115 released today The version is the last version update received by users of said system. Win7 and Win8 users
 How to solve the problem that Font Awesome is not displayed in Firefox under Apache/Nginx
May 21, 2023 pm 05:43 PM
1. nginx server solution The server uses nginx. To add the access-control-allow-origin field to the response header, the method of adding is to use the add_header directive: Configuration example: Copy the code as follows: location/assets/{gzip_staticon; expiresmax;add_headercache-controlpublic;add_headeraccess-control-allow-origin*;} 2. Apache server solution fontawesome (firefox cannot display fire
 Firefox 115 Beta released: Introducing Quick Actions
Mar 04, 2024 pm 03:10 PM
New news yesterday: While Mozilla released the Firefox 114 stable version update, it also shifted its development focus to the Firefox 115 version and launched the Beta version today. It is learned from reports that Firefox 115 introduces CookieBannerReduction and QuickActions buttons that were originally planned to be launched in version 114. After users enable CookieBannerReduction in Firefox version 115 and visit supported websites, the browser will automatically reject cookie requests on cookiebanners. The second feature is the QuickActions button on the address bar


