

Detailed explanation of jqPlot Option configuration object_jquery

Here we mainly introduce the core part of jqPlot - Option configuration object. At the same time, we will also give a brief introduction to each renderer of jqplot.
Here I mainly refer to the introduction of Option on the official website of jqPlot and use my own simple practice and understanding to explain the relevant attributes of Option. Please correct me if there are any inappropriate or wrong places.
options =
{
seriesColors: [ "#4bb2c5", "#c5b47f", "#EAA228", "#579575", "#839557", "#958c12",
"#953579", "#4b5de4", "#d8b83f", "#ff5800", "#0085cc"], // The default display color of the category,
//If the number of categories exceeds the number of colors here, Then start from the first position in the queue and assign the value to the corresponding category
stackSeries: false, // If set to true and there are multiple categories (if it is a line chart, there must be more than one line),
//Then the value of each category (polyline) on the vertical axis is the sum of the vertical axis values of all previous categories and the sum of its vertical
//axis values (eg, the current category vertical axis value is Y3
//, with Y2 and Y1 in front of it, then the value displayed on the Y axis is Y2 Y3 Y1. Currently, this attribute supports line graphs and bar graphs
title: '', //Set the title of the current graph
title: {
text: '', //Set the title of the current figure
show: true,//Set whether the current title is displayed
},
axisDefaults: {
show: false, // wether or not to renderer the axis. Determined automatically.
min: null, // The minimum value displayed by the horizontal (vertical) coordinate
max: null, // The maximum value displayed by the horizontal (vertical) coordinate Value
pad: 1.2, // A multiplication factor,
//(the maximum value of the data on the horizontal (vertical) axis - the minimum value of the data on the horizontal (vertical) axis) * pad value = the axis display The length of the horizontal (vertical) coordinate interval
// The length of the horizontal (vertical) coordinate interval displayed on this axis = the maximum value displayed by the horizontal (vertical) coordinate - the minimum value displayed by the horizontal (vertical) coordinate
// If If the values of max and min are set, the values set by min and max will be given priority
ticks: [], //Set the value on the scale of the horizontal (vertical) coordinate, which can be the value in the ticks array.
// a 1D [val1, val2, ...], or 2D [[val, label], [val, label], ...]
numberTicks: undefined, //A division factor, Used to set the horizontal (vertical) coordinate scale interval
//Horizontal (vertical) coordinate scale interval value = horizontal (vertical) coordinate interval length/(numberTicks-1)
tickInterval:'', //Horizontal (vertical) coordinate interval length ) Coordinate scale interval value, which can be a date string
renderer: $.jqplot.LinearAxisRenderer, // Set the renderer for loading data on the horizontal (vertical) axis, including dateAxisRenderer (see the relevant introduction at the end of this article).
rendererOptions: {}, // Set the Option configuration object of the renderer. Line charts do not need to be set.
// For the Option configuration objects of different charts, please refer to the following "Option Object Settings of Different Plugins for jqPlot"
//Configuration Option objects for each chart in
tickOptions: {
mark: 'outside', // Set the horizontal (vertical) coordinate scale display mode on the coordinate axis, which is divided into inside, outside, and through the coordinate axis Coordinate axis display
//Values are also divided into: 'outside', 'inside' and 'cross',
showMark: true, //Set whether to display scales
showGridLine: true, // Whether in the chart The area displays the grid lines in the direction of the scale value
markSize: 4, //The distance between each tick mark vertex and the point on the coordinate axis (in pixels)
//If the mark value is 'cross', Then each tick mark has an upper vertex and a lower vertex, and the tick mark intersects with the coordinate axis
//in the middle of the tick mark, then the distance is ×2,
show: true, // Whether to display the tick mark , grid lines in the same direction as the tick marks, and the scale values on the coordinate axis
showLabel: true, // Whether to display the tick marks and the scale values on the coordinate axis
formatString: '', // Set The scale value display format on the coordinate axis, eg:'%b %#d, %Y' means the format "month, day, year", "AUG 30,2008"
fontSize:'10px', //The font of the scale value Size
fontFamily:'Tahoma', //Font on the scale value
angle:40, //The angle between the scale value and the coordinate axis, the angle is the positive and clockwise direction of the coordinate axis
fontWeight:'normal' , //The thickness of the font
fontStretch:1//The degree of stretch (stretch) of the scale value in the direction (outside the coordinate axis)
}
showTicks: true, /// Whether to display tick marks And the tick value on the coordinate axis
showTickMarks: true, //Set whether to display the tick mark
useSeriesColor: true //If there are multiple vertical (horizontal) coordinate axes, use this property to set whether these coordinate axes are in different colors Display
},
axes: {
xaxis: {
// The settings are the same as axisDefaults
},
yaxis: {
// The settings are the same as axisDefaults
},
x2axis: {
// The settings are the same as axisDefaults
},
y2axis: {
// The settings are the same as axisDefaults
}
},
seriesDefaults: {// If there are multiple categories, you can set the common attributes of each category through this configuration attribute
show: true, // Set whether to render the entire chart area (i.e. display the content in the chart)
xaxis: 'xaxis', / / either 'xaxis' or 'x2axis'.
yaxis: 'yaxis', // either 'yaxis' or 'y2axis'.
label: '', // used for the category displayed in the category name box Name
color: '', // The color of the classification represented in the icon (discount, bar chart, etc.)
lineWidth: 2.5, // The width of the classification chart (especially the line chart)
shadow: true, // Whether each graph displays a shadow area in the chart
shadowAngle: 45, // Refer to the same parameters in the grid
shadowOffset: 1.25, // Refer to the same parameters in the grid
shadowDepth: 3, // Refer to the same parameters in the grid
shadowAlpha: 0.1, // Refer to the same parameters in the grid
showLine: true, //Whether to display the polyline in the chart (the polyline in the line chart)
showMarker: true, // Whether to highlight the data nodes in the graph
fill: false, // Whether to fill the area under the polyline in the graph (the fill color is the same as the polyline color) and the color of the category in the category name box set by legend
//This Note that if fill is true,
//then showLine must be true, otherwise the effect will not be displayed
fillAndStroke: false, //When fill is true, a line is displayed at the top of the filled area (If it is a line chart, the line will be displayed)
fillColor: undefined, // Set the color of the filled area
fillAlpha: undefined, // Set the transparency of the filled area
renderer: $.jqplot.PieRenderer, //Use the renderer (here, pie chart PieRenderer) to render the existing chart
//, thereby converting it into the required chart
rendererOptions: {}, // Pass the option to the renderer set by the previous attribute Object, the renderer of the line chart does not have an option object.
//For the Option configuration objects of different charts, please refer to the following "Option Object Settings of Different Plug-ins for jqPlot"
//The Configuration Option Objects of Each Chart
markerRenderer: $.jqplot.MarkerRenderer, // renderer to use to draw the data
// point markers.
markerOptions: {
show: true, // Whether to display data points in the graph
style: 'filledCircle', // The way each data point is displayed in the graph, the default is "filledCircle" (filled circle),
//Several other ways circle, diamond, square, filledCircle,
// filledDiamond or filledSquare.
lineWidth: 2, // The width of each side of the data point (if it is set too large, each side will be repeated and the display will be similar to a solid point)
size: 9, // Size of data point
color: '#666666' // Color of data point
shadow: true, // Whether to display shadow area for data point (increase three-dimensional effect)
shadowAngle: 45, // Shadow Zone angle, x-axis clockwise
shadowOffset: 1, // Refer to the same parameters in the grid
shadowDepth: 3, // Refer to the same parameters in the grid
shadowAlpha: 0.07 // Refer to the same parameters in the grid
}
isDragable: true, //Whether dragging is allowed (if the dragable package has been introduced), draggable by default
},
series:[//If there are multiple categories that need to be displayed, this Set the relevant configuration properties of each category here
//eg. Set the category name of each category in the category name box
//[label: 'Traps Division'},{label: 'Decoy Division'},{label: 'Harmony Division'}]
//Configuration parameter settings are the same as seriesDefaults
],
legend: {
show: false,//Set Whether the category name box appears (that is, the names of all categories appear at a certain location in the picture)
location: 'ne', // The location where the category name box appears, nw, n, ne, e, se, s, sw, w.
xoffset: 12, // The distance between the category name box and the upper border of the chart area (unit px)
yoffset: 12, // The distance between the category name box and the left border of the chart area (unit px)
background:'' //Background color of the category name box distance chart area
textColor:'' //Category name box distance font color within the chart area
..For other style design, please refer to the official document
},
grid: {
drawGridLines: true, // wether to draw lines across the grid or not.
gridLineColor: '#cccccc' // Set the color of the grid background line in the entire icon area
background : '#fffdf6', //Set the background color of the entire chart area
borderColor: '#999999', //Set the color of the chart's (outermost) border
borderWidth: 2.0, //Set the chart's ( Outermost) border width
shadow: true, // Set a shadow for the entire icon (outermost) border to highlight its three-dimensional effect
shadowAngle: 45, // Set the angle of the shadow area, clockwise from the x-axis Directional rotation
shadowOffset: 1.5, // Set the offset distance of the shadow area from the picture border
shadowWidth: 3, // Set the width of the shadow area
shadowDepth: 3, // Set the overlapping shadow of the audio and video area Amount
shadowAlpha: 0.07 // Set the transparency of the shadow area
renderer: $.jqplot.CanvasGridRenderer, // renderer to use to draw the grid.
rendererOptions: {} // options to pass to the renderer . Note, the default
// CanvasGridRenderer takes no additional options.
},
/**************************Option object settings for different jqPlot plug-ins************************ **********/
// BarRenderer (set the Option object of the histogram)
/ /This Option object applies to configuration object settings related to the series and seriesDefault properties of the histogram
seriesDefaults: {
rendererOptions: {
barPadding: 8, //Set the distance between two columnar bars of the same category (px)
barMargin: 10, //Set the distance (px) between two columnar bars of different categories (on the same abscissa point)
barDirection: 'vertical', //Set the histogram Display direction: vertical display and horizontal display
//, the default vertical display is vertical or horizontal.
barWidth: null, // Set the width of each column bar in the histogram
shadowOffset: 2, // Same attribute settings as grid
shadowDepth: 5, // Same attribute settings as grid
shadowAlpha: 0.8, // Same attribute settings as grid
}
},
// Cursor(cursor )
// When the mouse moves into the picture, the mouse is displayed in the picture. It is often used together with the highlight function.
// In addition, a certain area in the picture can be zoomed in by setting the zoom-related properties of this property. Drill (zoom in on the selected area)
//This configuration object is configured directly under option
cursor: {
style: 'crosshair', //When the mouse moves over the picture, the display of the mouse Style, the attribute value is css class
show: true, //Whether to display the cursor
showTooltip: true, //Whether to display the prompt information bar
followMouse: false, //Whether the cursor prompt information bar follows Move the cursor (mouse) together
tooltipLocation: 'se', // Set the position of the cursor tip information bar. If followMouse=true, then the position is
//The position of the prompt information bar relative to the cursor.Otherwise, prompt the position of the information bar in the icon for the cursor
// Optional values for this attribute: n, ne, e, se, etc.
tooltipOffset: 6, //The distance between the prompt information bar and the mouse (followMouse= true) or the position of the coordinate axis (followMouse=false)
showTooltipGridPosition: false,//Whether to display the cursor position in the information prompt bar (based on the pixel distance between the left and upper edges of the icon)
showTooltipUnitPosition: true, // Whether to display an information bar that prompts the position of the cursor (take its data value on the horizontal and vertical axes)
// Note: Note the difference between this and the showTooltipGridPosition value. The former displays the coordinate value, and the data value is displayed there
tooltipFormatString: '%.4P', // Same as Highlighter's tooltipFormatString
useAxesFormatters: true, // Same as Highlighter's tooltipFormatString
tooltipAxesGroups: [], // show only specified axes groups in tooltip. Would specify like :
// [['xaxis', 'yaxis'], ['xaxis', 'y2axis']]. By default, all axes
// combinations with for the series in the plot are shown.
},
// Dragable (drag)
//This configuration object is configured through seriesDefaults and series configuration objects
seriesDefaults: {
dragable: {
color: undefined, / / When dragging a data point, the drag line and drag data point color
constrainTo: 'none', //Set the dragging range: 'x' (can only be dragged horizontally),
// 'y' (can only be dragged vertically), or 'none' (unlimited).
},
},
// Highlighter (highlight)
// Set the highlight action option attribute object
//When the mouse moves to a certain data point, the data point increases and a prompt message box is displayed
//The configuration object is directly configured under the option
highlighter: {
lineWidthAdjust: 2.5, //When the mouse moves over the enlarged data point, set the width of the enlarged data point
// Currently only applicable to non-solid data points
sizeAdjust: 5, / / When the mouse moves to the data point, the increment of the data point expansion
showTooltip: true, // Whether to display the prompt information bar
tooltipLocation: 'nw', // The prompt information display position (English direction) initial letter): n, ne, e, se, s, sw, w, nw.
fadeTooltip: true, // Set the way the prompt information bar appears and disappears (whether to fade in or out)
tooltipFadeSpeed: "fast"//Set the fade-in and fade-out speed of the prompt information bar: slow, def, fast, or a value in milliseconds.
tooltipOffset: 2, // The offset of the highlighted data point in the prompt information bar Shift position, in pixels.
tooltipAxes: 'both', // The prompt information box displays the value on the coordinate axis of the data point. There are currently three modes: horizontal/vertical/horizontal and vertical.
//The values are x, y or xy.
tooltipSeparator: ', ' // The separation symbol between different values in the prompt information bar
useAxesFormatters: true // The format for displaying data in the prompt information box Is it consistent with the display format of the data on the coordinate axis?
tooltipFormatString: '%.5P' // Used to set the format of data display in the prompt information box, the prerequisite is useAxesFormatters
// is false. At this time the information The data format in the prompt box is no longer consistent with the coordinate axis, but is based on this
//At the same time, this attribute also supports html format strings
//eg:'< ;span style="color:red;">hello %.2f'
},
// LogAxisRenderer (exponential renderer)
// This renderer has only two properties. The index renderer is configured through axesDefaults and axes configuration objects
axesDefaults: {
base: 10, // The base of the index
tickDistribution: 'even', // Coordinate axis display mode: 'even' or 'power'. 'even' produces coordinate scale values evenly distributed on the coordinate
//axis.And 'power' determines the scale on the coordinate axis based on the increasing increment
},
// PieRenderer (sets the OPtion object of the pie chart)
// The pie chart passes seriesDefaults Configure with the series configuration object
seriesDefaults: {
rendererOptions: {
diameter: undefined, // Set the diameter of the pie
padding: 20, // The distance between the pie and its category name box or chart border Distance, disguised as the diameter of the pie
sliceMargin: 20, // The distance between each part of the pie
fill:true, // Set the filled state of each part of the pie
shadow:true , //Set a shadow for the border of each part of the pie to highlight its three-dimensional effect
shadowOffset: 2, //Set the distance by which the shadow area is offset from the border of each part of the pie
shadowDepth: 5, // Set the depth of the shadow area
shadowAlpha: 0.07 // Set the transparency of the shadow area
}
},
//pointLabels (data point labels)
//Used to position the data points Display relevant information (not a prompt box)
seriesDefaults: {
pointLabels: {
location:'s',//Data labels display the location near the data point
ypadding:2 //Data The distance between the label and the data point in the vertical axis direction
}
}
// Trendline (trend line)
// The pie chart is configured through seriesDefaults and series configuration objects
seriesDefaults: {
trendline: {
show: true, // Whether to display the trend line
color: '#666666', // Trend line color
label: '', // Trend line name
type: 'linear', //Trend line type 'linear' (straight line), 'exponential' (power value line) or 'exp'
shadow: true, // Same attribute settings as grid
lineWidth : 1.5, // Trend line width
shadowAngle: 45, // Same attribute settings as grid
shadowOffset: 1.5, // Same attribute settings as grid
shadowDepth: 3, // Same attribute settings as grid
shadowAlpha: 0.07 // Same attribute settings as grid
}
}
}
Related renderer introduction
1.dateAxisRenderer
Related reference package:
The renderer The tool is mainly used to display coordinate axes with scales in date format. It enhances the local data processing capabilities of JavaScript and supports almost all date formats.
In addition, the renderer also provides a powerful formatting function, which can format the date string in the data into the format you need and display it on the tick marks of the coordinate axis.
2.categoryAxisRenderer
Related reference package:
This renderer is mainly used Between the display of the value displayed at the scale and the two scales, of course its meaning changes, because the value at the scale represents the value at a certain point, and it represents the value within a certain range.
This renderer is more suitable for use in conjunction with histograms.
3.barRenderer
Related reference package:
This renderer is mainly used For displaying histograms, the renderer has good control over the distance within and between each group (each category at a scale value), and the histogram can be displayed horizontally.
4.cursor
Related reference package:

Hot AI Tools

Undresser.AI Undress
AI-powered app for creating realistic nude photos

AI Clothes Remover
Online AI tool for removing clothes from photos.

Undress AI Tool
Undress images for free

Clothoff.io
AI clothes remover

AI Hentai Generator
Generate AI Hentai for free.

Hot Article
Hot Tools

Notepad++7.3.1
Easy-to-use and free code editor

SublimeText3 Chinese version
Chinese version, very easy to use

Zend Studio 13.0.1
Powerful PHP integrated development environment

Dreamweaver CS6
Visual web development tools

SublimeText3 Mac version
God-level code editing software (SublimeText3)
Hot Topics


 Replace String Characters in JavaScript
Mar 11, 2025 am 12:07 AM
Replace String Characters in JavaScript
Mar 11, 2025 am 12:07 AM
Detailed explanation of JavaScript string replacement method and FAQ This article will explore two ways to replace string characters in JavaScript: internal JavaScript code and internal HTML for web pages. Replace string inside JavaScript code The most direct way is to use the replace() method: str = str.replace("find","replace"); This method replaces only the first match. To replace all matches, use a regular expression and add the global flag g: str = str.replace(/fi
 8 Stunning jQuery Page Layout Plugins
Mar 06, 2025 am 12:48 AM
8 Stunning jQuery Page Layout Plugins
Mar 06, 2025 am 12:48 AM
Leverage jQuery for Effortless Web Page Layouts: 8 Essential Plugins jQuery simplifies web page layout significantly. This article highlights eight powerful jQuery plugins that streamline the process, particularly useful for manual website creation
 Build Your Own AJAX Web Applications
Mar 09, 2025 am 12:11 AM
Build Your Own AJAX Web Applications
Mar 09, 2025 am 12:11 AM
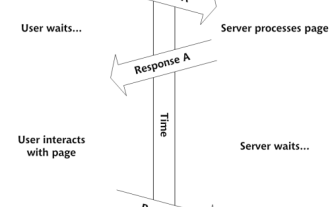
So here you are, ready to learn all about this thing called AJAX. But, what exactly is it? The term AJAX refers to a loose grouping of technologies that are used to create dynamic, interactive web content. The term AJAX, originally coined by Jesse J
 10 Mobile Cheat Sheets for Mobile Development
Mar 05, 2025 am 12:43 AM
10 Mobile Cheat Sheets for Mobile Development
Mar 05, 2025 am 12:43 AM
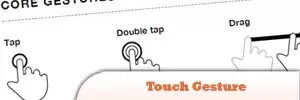
This post compiles helpful cheat sheets, reference guides, quick recipes, and code snippets for Android, Blackberry, and iPhone app development. No developer should be without them! Touch Gesture Reference Guide (PDF) A valuable resource for desig
 Improve Your jQuery Knowledge with the Source Viewer
Mar 05, 2025 am 12:54 AM
Improve Your jQuery Knowledge with the Source Viewer
Mar 05, 2025 am 12:54 AM
jQuery is a great JavaScript framework. However, as with any library, sometimes it’s necessary to get under the hood to discover what’s going on. Perhaps it’s because you’re tracing a bug or are just curious about how jQuery achieves a particular UI
 10 jQuery Fun and Games Plugins
Mar 08, 2025 am 12:42 AM
10 jQuery Fun and Games Plugins
Mar 08, 2025 am 12:42 AM
10 fun jQuery game plugins to make your website more attractive and enhance user stickiness! While Flash is still the best software for developing casual web games, jQuery can also create surprising effects, and while not comparable to pure action Flash games, in some cases you can also have unexpected fun in your browser. jQuery tic toe game The "Hello world" of game programming now has a jQuery version. Source code jQuery Crazy Word Composition Game This is a fill-in-the-blank game, and it can produce some weird results due to not knowing the context of the word. Source code jQuery mine sweeping game
 How do I create and publish my own JavaScript libraries?
Mar 18, 2025 pm 03:12 PM
How do I create and publish my own JavaScript libraries?
Mar 18, 2025 pm 03:12 PM
Article discusses creating, publishing, and maintaining JavaScript libraries, focusing on planning, development, testing, documentation, and promotion strategies.
 jQuery Parallax Tutorial - Animated Header Background
Mar 08, 2025 am 12:39 AM
jQuery Parallax Tutorial - Animated Header Background
Mar 08, 2025 am 12:39 AM
This tutorial demonstrates how to create a captivating parallax background effect using jQuery. We'll build a header banner with layered images that create a stunning visual depth. The updated plugin works with jQuery 1.6.4 and later. Download the
