 Web Front-end
 JS Tutorial
 Javascript debugging tool Firebug detailed explanation 6_javascript skills
Javascript debugging tool Firebug detailed explanation 6_javascript skills
Let’s test the 4 outputs just now as a group output, modify the code to:
console.group('Start grouping:');
console.debug('This is console.debug!');
console.info('This is console.info !');
console.warn('This is console.warn!');
console.error('This is console.error!');
console.groupEnd();
Refresh the page to see the results (Figure 11-5). In console.group, we can also add a group title "Start grouping:". If necessary, we can also group them within groups through nesting.
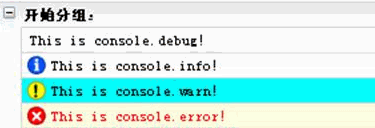
Figure 11-5
Sometimes, we need to write a for loop to list all attributes of an object or all nodes under a certain HTML Element. With firebug, we don’t need to To write this for loop again, we only need to use console.dir(object) or console.dirxml(element).
Add the code to the test page to test:
console.dir(document.getElementById('div1'));
console.dirxml(document.getElementById('div1'));
Please see Figure 11-6 and Figure 11 for the results -7.
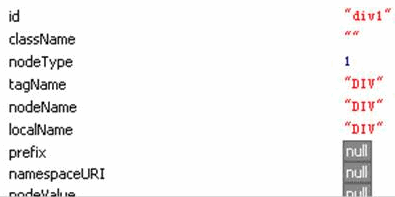
Figure 11-6

Figure 11-7
Want to know how fast the code runs? It's very simple, just use console.time and console.timeEnd.
Modify the code of the test function and test how long it takes to run the loop 1000 times:
function test(){
console.time('test');
for(var i=0;i<1000;i ){
document.getElementById(' div2').innerHTML=i;
//console.log('The current parameter is: %d',i);
}
console.timeEnd('test');
}
刷新页面,单击“方块二”,看看结果(图11-8)。在这里要注意的是console.time和console.timeEnd里的参数要一致才会有正确的输出,而该参数就是信息的标题。

图11-8
是否想知道某个函数是从哪里调用的?console..trace可帮助我们进行追踪。在test函数的结尾加入:
console.trace();
刷新页面,单击“方块二”,看看结果(图11-9)。结果显示是在坐标(97,187)的鼠标单击事件执行了test函数,而调用的脚本是在simple.html文件里的第1行。因为是在HTML里面的事件调用了test函数,所以显示的行号是第1行。如果是脚本,则会显示调用脚本的行号,通过单击可以直接去到调用行。

图11-9
如果想在脚本某个位置设置断点,可以在脚本中输入“debugger”作为一行。当脚本执行到这一行时会停止执行等待用户操作,这时候可以通过切换到“Script”标签对脚本进行调试。
Firebug还有其它的一些调试函数,这里就不一一做介绍,有兴趣可以自己测试。表4是所有函数的列表:
|
函数 |
说明 |
| console.log(object[, object, ...]) |
向控制台输出一个信息。可以输入多个参数,输出将已空格分隔各参数输出。 第一参数可以包含格式化文本,例如: console.log(‘这里有%d个%s',count,apple); 字符串格式: %s :字符串。 %d, %i:数字。 %f: 浮点数。 %o -超链接对象。 |
|
console.debug(object[, object, ...]) |
向控制台输出一个信息,信息包含一个超链接链接到输出位置。 |
|
console.info(object[, object, ...]) |
向控制台输出一个带信息图标和背景颜色的信息,信息包含一个超链接链接到输出位置。 |
|
console.warn(object[, object, ...]) |
向控制台输出一个带警告图标和背景颜色的信息,信息包含一个超链接链接到输出位置。 |
|
console.error(object[, object, ...]) |
向控制台输出一个带错误图标和背景颜色的信息,信息包含一个超链接链接到输出位置。 |
|
console.assert(expression[, object, ...]) |
测试一个表示是否为true,如果为false,提交一个例外信息到控制台。 |
|
console.dir(object) |
列出对象的所有属性。 |
|
console.dirxml(node) |
列出HTML或XML Element的XML源树。 |
|
console.trace() |
输出堆栈的调用入口。 |
|
console.group(object[, object, ...]) |
将信息分组再输出到控制台。通过console.groupEnd()结束分组。 |
|
console.groupEnd() |
结束分组输出。 |
|
console.time(name) |
创建一个名称为name的计时器,计算代码的执行时间,调用console.timeEnd(name)停止计时器并输出执行时间。 |
|
console.timeEnd(name) |
停止名称为name的计时器并输出执行时间。 |
|
console.profile([title]) |
开始对脚本进行性能测试,title为测试标题。 |
|
console.profileEnd() |
结束性能测试。 |
|
console.count([title]) |
计算代码的执行次数。titile作为输出标题。 |
|
表4 | |
12. Using Firebug in IE
Firebug is an extension of Firefox, but what should I do if I am used to debugging my page in IE? If you add console.log() to the page script to write debugging information to Friebug, an error will definitely be prompted in IE. What should I do? Don't worry, Frirebug provides Frirbug Lite scripts that can be inserted into the page to simulate the Firebug console.
We can download firebug lite from the following address:
http://www.getfirebug.com/releases/firebuglite1.0-b1.zip
Then add to the page:
If you don't want to emulate the Friebug console in IE, just don't want console.log() If an error message appears in the script, add the following statement to the page:
If you don’t want to install Firebug Lite and just want to avoid script errors, you can add the following statement to the script:
if (!window.console || !console.firebug)
{
var names = [ "log", "debug", "info", "warn", "error", "assert", "dir", "dirxml",
"group", "groupEnd", "time", "timeEnd" , "count", "trace", "profile", "profileEnd"];
window.console = {};
for (var i = 0; i < names.length; i)
window.console[names[i]] = function() {}
}
We add firebug.js to the test page, then open IE and load the page. After the page is loaded, we can open the console by pressing the F12 key. Isn’t it annoying that you have to press the F12 key to open the console every time the page is refreshed? If you don't want to do that, just add "debug='true'" to the html tag, for example:
There is also a command line in Friebug Lite, but the function is not as powerful.

Hot AI Tools

Undresser.AI Undress
AI-powered app for creating realistic nude photos

AI Clothes Remover
Online AI tool for removing clothes from photos.

Undress AI Tool
Undress images for free

Clothoff.io
AI clothes remover

AI Hentai Generator
Generate AI Hentai for free.

Hot Article

Hot Tools

Notepad++7.3.1
Easy-to-use and free code editor

SublimeText3 Chinese version
Chinese version, very easy to use

Zend Studio 13.0.1
Powerful PHP integrated development environment

Dreamweaver CS6
Visual web development tools

SublimeText3 Mac version
God-level code editing software (SublimeText3)

Hot Topics
 1359
1359
 52
52
 How to implement an online speech recognition system using WebSocket and JavaScript
Dec 17, 2023 pm 02:54 PM
How to use WebSocket and JavaScript to implement an online speech recognition system Introduction: With the continuous development of technology, speech recognition technology has become an important part of the field of artificial intelligence. The online speech recognition system based on WebSocket and JavaScript has the characteristics of low latency, real-time and cross-platform, and has become a widely used solution. This article will introduce how to use WebSocket and JavaScript to implement an online speech recognition system.
 WebSocket and JavaScript: key technologies for implementing real-time monitoring systems
Dec 17, 2023 pm 05:30 PM
WebSocket and JavaScript: Key technologies for realizing real-time monitoring systems Introduction: With the rapid development of Internet technology, real-time monitoring systems have been widely used in various fields. One of the key technologies to achieve real-time monitoring is the combination of WebSocket and JavaScript. This article will introduce the application of WebSocket and JavaScript in real-time monitoring systems, give code examples, and explain their implementation principles in detail. 1. WebSocket technology
 How to implement an online reservation system using WebSocket and JavaScript
Dec 17, 2023 am 09:39 AM
How to use WebSocket and JavaScript to implement an online reservation system. In today's digital era, more and more businesses and services need to provide online reservation functions. It is crucial to implement an efficient and real-time online reservation system. This article will introduce how to use WebSocket and JavaScript to implement an online reservation system, and provide specific code examples. 1. What is WebSocket? WebSocket is a full-duplex method on a single TCP connection.
 How to use JavaScript and WebSocket to implement a real-time online ordering system
Dec 17, 2023 pm 12:09 PM
Introduction to how to use JavaScript and WebSocket to implement a real-time online ordering system: With the popularity of the Internet and the advancement of technology, more and more restaurants have begun to provide online ordering services. In order to implement a real-time online ordering system, we can use JavaScript and WebSocket technology. WebSocket is a full-duplex communication protocol based on the TCP protocol, which can realize real-time two-way communication between the client and the server. In the real-time online ordering system, when the user selects dishes and places an order
 JavaScript and WebSocket: Building an efficient real-time weather forecasting system
Dec 17, 2023 pm 05:13 PM
JavaScript and WebSocket: Building an efficient real-time weather forecast system Introduction: Today, the accuracy of weather forecasts is of great significance to daily life and decision-making. As technology develops, we can provide more accurate and reliable weather forecasts by obtaining weather data in real time. In this article, we will learn how to use JavaScript and WebSocket technology to build an efficient real-time weather forecast system. This article will demonstrate the implementation process through specific code examples. We
 Simple JavaScript Tutorial: How to Get HTTP Status Code
Jan 05, 2024 pm 06:08 PM
JavaScript tutorial: How to get HTTP status code, specific code examples are required. Preface: In web development, data interaction with the server is often involved. When communicating with the server, we often need to obtain the returned HTTP status code to determine whether the operation is successful, and perform corresponding processing based on different status codes. This article will teach you how to use JavaScript to obtain HTTP status codes and provide some practical code examples. Using XMLHttpRequest
 How to use insertBefore in javascript
Nov 24, 2023 am 11:56 AM
Usage: In JavaScript, the insertBefore() method is used to insert a new node in the DOM tree. This method requires two parameters: the new node to be inserted and the reference node (that is, the node where the new node will be inserted).
 How to get HTTP status code in JavaScript the easy way
Jan 05, 2024 pm 01:37 PM
Introduction to the method of obtaining HTTP status code in JavaScript: In front-end development, we often need to deal with the interaction with the back-end interface, and HTTP status code is a very important part of it. Understanding and obtaining HTTP status codes helps us better handle the data returned by the interface. This article will introduce how to use JavaScript to obtain HTTP status codes and provide specific code examples. 1. What is HTTP status code? HTTP status code means that when the browser initiates a request to the server, the service


