
 Web Front-end
JS Tutorial
js dynamically add tags (adding a new line, it is actually very simple, just the application of several functions)_javascript skills
Web Front-end
JS Tutorial
js dynamically add tags (adding a new line, it is actually very simple, just the application of several functions)_javascript skills
js dynamically add tags (adding a new line, it is actually very simple, just the application of several functions)_javascript skills

把所有代码拷下另存为一个html文件,在浏览器中打开,点击“新增一行”按钮就可以,以下是对js函数的解释
document.createElement 创建一种页面标签
setAttribute:为某一标签设置属性
appendChild:在另一标签中添加一子标签

Hot AI Tools

Undresser.AI Undress
AI-powered app for creating realistic nude photos

AI Clothes Remover
Online AI tool for removing clothes from photos.

Undress AI Tool
Undress images for free

Clothoff.io
AI clothes remover

Video Face Swap
Swap faces in any video effortlessly with our completely free AI face swap tool!

Hot Article
Hot Tools

Notepad++7.3.1
Easy-to-use and free code editor

SublimeText3 Chinese version
Chinese version, very easy to use

Zend Studio 13.0.1
Powerful PHP integrated development environment

Dreamweaver CS6
Visual web development tools

SublimeText3 Mac version
God-level code editing software (SublimeText3)
Hot Topics
 1392
1392
 52
52

 Recommended: Excellent JS open source face detection and recognition project
Apr 03, 2024 am 11:55 AM
Recommended: Excellent JS open source face detection and recognition project
Apr 03, 2024 am 11:55 AM
Face detection and recognition technology is already a relatively mature and widely used technology. Currently, the most widely used Internet application language is JS. Implementing face detection and recognition on the Web front-end has advantages and disadvantages compared to back-end face recognition. Advantages include reducing network interaction and real-time recognition, which greatly shortens user waiting time and improves user experience; disadvantages include: being limited by model size, the accuracy is also limited. How to use js to implement face detection on the web? In order to implement face recognition on the Web, you need to be familiar with related programming languages and technologies, such as JavaScript, HTML, CSS, WebRTC, etc. At the same time, you also need to master relevant computer vision and artificial intelligence technologies. It is worth noting that due to the design of the Web side
 How to create a stock candlestick chart using PHP and JS
Dec 17, 2023 am 08:08 AM
How to create a stock candlestick chart using PHP and JS
Dec 17, 2023 am 08:08 AM
How to use PHP and JS to create a stock candle chart. A stock candle chart is a common technical analysis graphic in the stock market. It helps investors understand stocks more intuitively by drawing data such as the opening price, closing price, highest price and lowest price of the stock. price fluctuations. This article will teach you how to create stock candle charts using PHP and JS, with specific code examples. 1. Preparation Before starting, we need to prepare the following environment: 1. A server running PHP 2. A browser that supports HTML5 and Canvas 3
 Essential tools for stock analysis: Learn the steps to draw candle charts with PHP and JS
Dec 17, 2023 pm 06:55 PM
Essential tools for stock analysis: Learn the steps to draw candle charts with PHP and JS
Dec 17, 2023 pm 06:55 PM
Essential tools for stock analysis: Learn the steps to draw candle charts in PHP and JS. Specific code examples are required. With the rapid development of the Internet and technology, stock trading has become one of the important ways for many investors. Stock analysis is an important part of investor decision-making, and candle charts are widely used in technical analysis. Learning how to draw candle charts using PHP and JS will provide investors with more intuitive information to help them make better decisions. A candlestick chart is a technical chart that displays stock prices in the form of candlesticks. It shows the stock price
 How to search for text across all tabs in Chrome and Edge
Feb 19, 2024 am 11:30 AM
How to search for text across all tabs in Chrome and Edge
Feb 19, 2024 am 11:30 AM
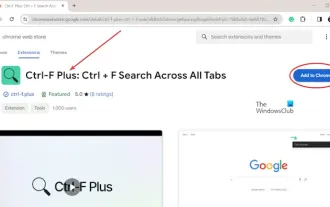
This tutorial shows you how to find specific text or phrases on all open tabs in Chrome or Edge on Windows. Is there a way to do a text search on all open tabs in Chrome? Yes, you can use a free external web extension in Chrome to perform text searches on all open tabs without having to switch tabs manually. Some extensions like TabSearch and Ctrl-FPlus can help you achieve this easily. How to search text across all tabs in Google Chrome? Ctrl-FPlus is a free extension that makes it easy for users to search for a specific word, phrase or text across all tabs of their browser window. This expansion
 How to use JS and Baidu Map to implement map click event processing function
Nov 21, 2023 am 11:11 AM
How to use JS and Baidu Map to implement map click event processing function
Nov 21, 2023 am 11:11 AM
Overview of how to use JS and Baidu Maps to implement map click event processing: In web development, it is often necessary to use map functions to display geographical location and geographical information. Click event processing on the map is a commonly used and important part of the map function. This article will introduce how to use JS and Baidu Map API to implement the click event processing function of the map, and give specific code examples. Steps: Import the API file of Baidu Map. First, import the file of Baidu Map API in the HTML file. This can be achieved through the following code:
 PHP and JS Development Tips: Master the Method of Drawing Stock Candle Charts
Dec 18, 2023 pm 03:39 PM
PHP and JS Development Tips: Master the Method of Drawing Stock Candle Charts
Dec 18, 2023 pm 03:39 PM
With the rapid development of Internet finance, stock investment has become the choice of more and more people. In stock trading, candle charts are a commonly used technical analysis method. It can show the changing trend of stock prices and help investors make more accurate decisions. This article will introduce the development skills of PHP and JS, lead readers to understand how to draw stock candle charts, and provide specific code examples. 1. Understanding Stock Candle Charts Before introducing how to draw stock candle charts, we first need to understand what a candle chart is. Candlestick charts were developed by the Japanese
 How to add tags on Douyin to attract traffic? Which tags on the platform are easiest to attract traffic to?
Mar 22, 2024 am 10:28 AM
How to add tags on Douyin to attract traffic? Which tags on the platform are easiest to attract traffic to?
Mar 22, 2024 am 10:28 AM
As a popular short video social platform, Douyin has a huge user base. For Douyin creators, using tags to attract traffic is an effective way to increase the exposure of content and attract attention. So, how does Douyin use tags to attract traffic? This article will answer this question in detail for you and introduce related techniques. 1. How to add tags on Douyin to attract traffic? When posting a video, make sure to choose tags that are relevant to the content. These tags should cover the topic and keywords of your video to make it easier for users to find your video through tags. Leveraging popular hashtags is an effective way to increase your video’s exposure. Research current popular tags and trends and incorporate them into your video descriptions and tags. These popular tags usually have higher visibility and can attract the attention of more viewers. 3. Label
 What is the clock behind the TikTok label? How to tag Douyin account?
Mar 24, 2024 pm 03:46 PM
What is the clock behind the TikTok label? How to tag Douyin account?
Mar 24, 2024 pm 03:46 PM
When browsing Douyin works, we often see a clock icon behind the tag. So, what exactly is this clock? This article will focus on the discussion of "What is the clock behind the Douyin label", hoping to provide some useful reference for your use of Douyin. 1. What is the clock behind the Douyin label? Douyin will launch some hot topic challenges. When users participate, they will see a clock icon after the tag, which means that the work is participating in the topic challenge and displays the remaining time of the challenge. For some time-sensitive content, such as holidays, special events, etc., Douyin will attach a clock icon after the label to remind users of the validity period of the content. 3. Popular tags: When a tag becomes popular, Douyin will add a clock icon after the tag to indicate that the tag is
