Summary of javascript script debugging methods_javascript skills
This is also a very primitive method, but it is very troublesome to debug.
2. Debugger method
First open Internet Options - Advanced, and uncheck "Disable script debugging (Internet Explorer)"
If you want to enable debugging in other browsers, you can change " Also uncheck "Disable script debugging (other)".
Then add debugger where you want to debug, such as
Open the page with IE, and VS2005 will be automatically called for debugging.
Click Yes, as usual Press F10 or F11 to debug
Anyone who is currently or preparing to engage in javascript programming will use this magical thing and feel extremely proud.
It can achieve almost any function you want without using any tools.
Then, anyone who has used it will know that this kind of programming script is quite troublesome when it comes to query errors or it is called debugging.
Below, I combine some of my own experiences, and of course some of them come from the Internet. Haha
1. Use the alert function
This function is most used during debugging. For a certain variable or array, if you think there may be a problem there, just there Local alert output, haha.
2. Use the syntax highlighting function of the editor
For some spellings, there may be errors. It is a good way to use an editor with syntax highlighting function. Currently, there is a grammar There are many editors with highlighting functions, such as editplus, UltraEdit, Dreamweaver, etc. If there are spelling errors of keywords (perhaps accurate reserved words) when writing code, they will be given in different colors.
document.write("hello World!");
If there is a spelling error in the reserved word in the previous sentence, the color will give a prompt,
documents.write("hello World!"); 3. Pay attention to the difference in size
(Note that html is not case-sensitive, but if your js code is written directly in html, it will seem to be different in size. You must pay attention to this)
This kind of scripting language is strictly case-sensitive. If you spell it wrong, not only will the color be wrong, but it will also cause a method error and you will not be able to continue execution.
4. Pairing of brackets
The brackets here include commonly used braces and brackets, which is an important point when checking.
5. Strictly implement the code indentation style
This is also very important, especially when querying errors. Of course, you can’t maintain this style just because of this. You are very good at it. Save time.
6. Use the browser to run and debug
In fact, every browser has a display function for errors, such as IE series, FF, etc., but you just haven’t noticed it. Let’s focus on it here. The debugging function of FF is particularly easy to use.
FF itself has an error console function. After it is turned on, it will prompt error messages. Of course, the most useful ones are Web Developer and FireBug plug-ins. There are many articles on how to use these two plug-ins.

Hot AI Tools

Undresser.AI Undress
AI-powered app for creating realistic nude photos

AI Clothes Remover
Online AI tool for removing clothes from photos.

Undress AI Tool
Undress images for free

Clothoff.io
AI clothes remover

Video Face Swap
Swap faces in any video effortlessly with our completely free AI face swap tool!

Hot Article

Hot Tools

Notepad++7.3.1
Easy-to-use and free code editor

SublimeText3 Chinese version
Chinese version, very easy to use

Zend Studio 13.0.1
Powerful PHP integrated development environment

Dreamweaver CS6
Visual web development tools

SublimeText3 Mac version
God-level code editing software (SublimeText3)

Hot Topics
 1392
1392
 52
52
 How to create a script for editing? Tutorial on how to create a script through editing
Mar 13, 2024 pm 12:46 PM
Cutting is a video editing tool with comprehensive editing functions, support for variable speed, various filters and beauty effects, and rich music library resources. In this software, you can edit videos directly or create editing scripts, but how to do it? In this tutorial, the editor will introduce the method of editing and making scripts. Production method: 1. Click to open the editing software on your computer, then find the "Creation Script" option and click to open. 2. In the creation script page, enter the "script title", and then enter a brief introduction to the shooting content in the outline. 3. How can I see the "Storyboard Description" option in the outline?
 How to execute .sh file in Linux system?
Mar 14, 2024 pm 06:42 PM
How to execute .sh file in Linux system? In Linux systems, a .sh file is a file called a Shell script, which is used to execute a series of commands. Executing .sh files is a very common operation. This article will introduce how to execute .sh files in Linux systems and provide specific code examples. Method 1: Use an absolute path to execute a .sh file. To execute a .sh file in a Linux system, you can use an absolute path to specify the location of the file. The following are the specific steps: Open the terminal
 How to implement an online speech recognition system using WebSocket and JavaScript
Dec 17, 2023 pm 02:54 PM
How to use WebSocket and JavaScript to implement an online speech recognition system Introduction: With the continuous development of technology, speech recognition technology has become an important part of the field of artificial intelligence. The online speech recognition system based on WebSocket and JavaScript has the characteristics of low latency, real-time and cross-platform, and has become a widely used solution. This article will introduce how to use WebSocket and JavaScript to implement an online speech recognition system.
 WebSocket and JavaScript: key technologies for implementing real-time monitoring systems
Dec 17, 2023 pm 05:30 PM
WebSocket and JavaScript: Key technologies for realizing real-time monitoring systems Introduction: With the rapid development of Internet technology, real-time monitoring systems have been widely used in various fields. One of the key technologies to achieve real-time monitoring is the combination of WebSocket and JavaScript. This article will introduce the application of WebSocket and JavaScript in real-time monitoring systems, give code examples, and explain their implementation principles in detail. 1. WebSocket technology
 How to use JavaScript and WebSocket to implement a real-time online ordering system
Dec 17, 2023 pm 12:09 PM
Introduction to how to use JavaScript and WebSocket to implement a real-time online ordering system: With the popularity of the Internet and the advancement of technology, more and more restaurants have begun to provide online ordering services. In order to implement a real-time online ordering system, we can use JavaScript and WebSocket technology. WebSocket is a full-duplex communication protocol based on the TCP protocol, which can realize real-time two-way communication between the client and the server. In the real-time online ordering system, when the user selects dishes and places an order
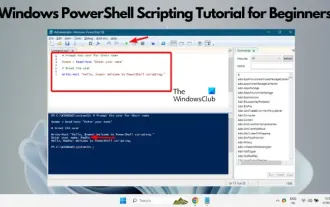
 Windows PowerShell Scripting Tutorial for Beginners
Mar 13, 2024 pm 10:55 PM
We've designed this Windows PowerShell scripting tutorial for beginners, whether you're a tech enthusiast or a professional looking to improve your scripting skills. If you have no prior knowledge of PowerShell scripting, this article will start with the basics and be tailored for you. We'll help you master the installation steps for a PowerShell environment and walk you through the main concepts and features of PowerShell scripts. If you're ready to learn more about PowerShell scripting, let's embark on this exciting learning journey together! What is WindowsPowerShell? PowerShell is a hybrid command system developed by Microsoft
 How to implement an online reservation system using WebSocket and JavaScript
Dec 17, 2023 am 09:39 AM
How to use WebSocket and JavaScript to implement an online reservation system. In today's digital era, more and more businesses and services need to provide online reservation functions. It is crucial to implement an efficient and real-time online reservation system. This article will introduce how to use WebSocket and JavaScript to implement an online reservation system, and provide specific code examples. 1. What is WebSocket? WebSocket is a full-duplex method on a single TCP connection.
 JavaScript and WebSocket: Building an efficient real-time weather forecasting system
Dec 17, 2023 pm 05:13 PM
JavaScript and WebSocket: Building an efficient real-time weather forecast system Introduction: Today, the accuracy of weather forecasts is of great significance to daily life and decision-making. As technology develops, we can provide more accurate and reliable weather forecasts by obtaining weather data in real time. In this article, we will learn how to use JavaScript and WebSocket technology to build an efficient real-time weather forecast system. This article will demonstrate the implementation process through specific code examples. We


