求助,Xdebug的配置,缓存问题。
zend php xdebug grind
是用的是wamp自带了xdebug,一开始始终都用不了grind(xdebug的网页面板)。然后修改了php.ini,可以了。但是却发现一个问题,只要是运行PHP程序,就会被监听。在D:\wamp\tmp下面生成他的缓存文件。cachegrind.out.%t.%p。
然后出现的问题,本来120GB的D盘,不到一个月今天居然提示磁盘已满。。。
检查才发现全部都是xdebug目录占用了。
我现在想弄清楚的是
(1)如果开启xdebug,那么所有的php运行都会被监听吗?而不是部分?
(2)如果第一个是否的,那么如何才可以只针对部分开启xdebug监控?他的说明中有一个网址参数“XDEBUG_PROFILE”,网址中夹带这个“ XDEBUG_PROFILE”字串就会被监听。(但是一开始我这样操作却没有反应)
我的PHP的配置:
[dba];dba.default_handler=; Local Variables:; tab-width: 4; End:; XDEBUG Extensionzend_extension = "d:/wamp/bin/php/php5.4.3/zend_ext/php_xdebug-2.2.0-5.4-vc9.dll"[xdebug]xdebug.remote_enable = onxdebug.profiler_enable = onxdebug.profiler_enable_trigger = onxdebug.profiler_output_name = cachegrind.out.%t.%pxdebug.profiler_output_dir = "d:/wamp/tmp"
回复讨论(解决方案)
[Xdebug]
;extension="php_xdebug-2.1.0-5.2-vc6.dll"
zend_extension_ts="D:\xdebug\php_xdebug-2.1.0-5.2-vc6.dll"
xdebug.auto_trace=on
xdebug.collect_params=on
xdebug.collect_return=on
xdebug.trace_output_dir="D:\xdebug"
xdebug.profiler_enable=on
xdebug.profiler_output_dir="D:\xdebug"
xdebug.dump.GET=*
xdebug.show_local_vars=1
xdebug.profiler_output_name = cachegrind.out.%s
我也遇到了楼主说的问题,大量的cachegrind文件占满了磁盘,如何才能控制这些文件的生成?
自行删除监听缓存文件
不需监听时把 on 都 off 了
只利用 xdebug 美化了的 var_dump 和 错误报告
xdebug 会在 php 语法分析期间插入大量监听代码,非调试状态不要使用
一般只需依据 php 原始的错误信息和输出个别变量值就可完成调试工作
多谢版主!!!

Hot AI Tools

Undresser.AI Undress
AI-powered app for creating realistic nude photos

AI Clothes Remover
Online AI tool for removing clothes from photos.

Undress AI Tool
Undress images for free

Clothoff.io
AI clothes remover

AI Hentai Generator
Generate AI Hentai for free.

Hot Article

Hot Tools

Notepad++7.3.1
Easy-to-use and free code editor

SublimeText3 Chinese version
Chinese version, very easy to use

Zend Studio 13.0.1
Powerful PHP integrated development environment

Dreamweaver CS6
Visual web development tools

SublimeText3 Mac version
God-level code editing software (SublimeText3)

Hot Topics
 Working with Flash Session Data in Laravel
Mar 12, 2025 pm 05:08 PM
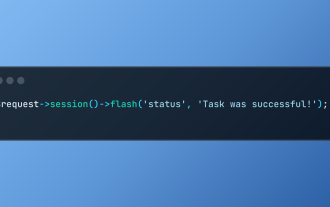
Laravel simplifies handling temporary session data using its intuitive flash methods. This is perfect for displaying brief messages, alerts, or notifications within your application. Data persists only for the subsequent request by default: $request-
 cURL in PHP: How to Use the PHP cURL Extension in REST APIs
Mar 14, 2025 am 11:42 AM
The PHP Client URL (cURL) extension is a powerful tool for developers, enabling seamless interaction with remote servers and REST APIs. By leveraging libcurl, a well-respected multi-protocol file transfer library, PHP cURL facilitates efficient execution of various network protocols, including HTTP, HTTPS, and FTP. This extension offers granular control over HTTP requests, supports multiple concurrent operations, and provides built-in security features.
 Simplified HTTP Response Mocking in Laravel Tests
Mar 12, 2025 pm 05:09 PM
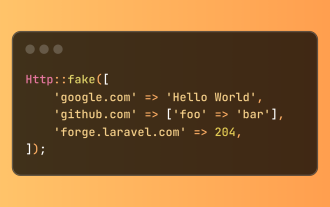
Laravel provides concise HTTP response simulation syntax, simplifying HTTP interaction testing. This approach significantly reduces code redundancy while making your test simulation more intuitive. The basic implementation provides a variety of response type shortcuts: use Illuminate\Support\Facades\Http; Http::fake([ 'google.com' => 'Hello World', 'github.com' => ['foo' => 'bar'], 'forge.laravel.com' =>
 12 Best PHP Chat Scripts on CodeCanyon
Mar 13, 2025 pm 12:08 PM
Do you want to provide real-time, instant solutions to your customers' most pressing problems? Live chat lets you have real-time conversations with customers and resolve their problems instantly. It allows you to provide faster service to your custom
 Explain the concept of late static binding in PHP.
Mar 21, 2025 pm 01:33 PM
Article discusses late static binding (LSB) in PHP, introduced in PHP 5.3, allowing runtime resolution of static method calls for more flexible inheritance.Main issue: LSB vs. traditional polymorphism; LSB's practical applications and potential perfo
 PHP Logging: Best Practices for PHP Log Analysis
Mar 10, 2025 pm 02:32 PM
PHP logging is essential for monitoring and debugging web applications, as well as capturing critical events, errors, and runtime behavior. It provides valuable insights into system performance, helps identify issues, and supports faster troubleshoot
 HTTP Method Verification in Laravel
Mar 05, 2025 pm 04:14 PM
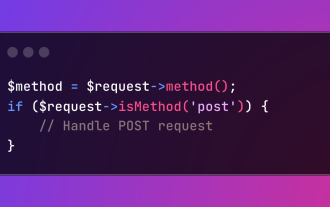
Laravel simplifies HTTP verb handling in incoming requests, streamlining diverse operation management within your applications. The method() and isMethod() methods efficiently identify and validate request types. This feature is crucial for building
 Discover File Downloads in Laravel with Storage::download
Mar 06, 2025 am 02:22 AM
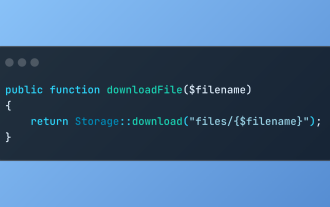
The Storage::download method of the Laravel framework provides a concise API for safely handling file downloads while managing abstractions of file storage. Here is an example of using Storage::download() in the example controller:


