 Backend Development
 PHP Tutorial
 Xdebug document (7) Remote debugging, xdebug document debugging_PHP tutorial
Xdebug document (7) Remote debugging, xdebug document debugging_PHP tutorial
Xdebug document (7) Remote debugging, xdebug document debugging
Xdebug prompts that the debugging client interface is connected to PHP running. This chapter explains how to set up PHP with xdebug, and recommends some clients.
Introduction
Xdebug's remote debugger allows you to inspect data structures, step through and debug your code interactively. The protocol is already open and is called DBGp. This protocol was implemented in xdebug2 and replaces an older GDB similar protocol that is no longer supported.
Client
Xdebug2 bundles a simple command line tool using the DBGp protocol. There are other clients that do a good job (free or commercial).
- Dev-PHP (IDE: Windows)
- Eclipse plugin (IDE).
- Emacs plugin (Editor Plugin).
- KDevelop (IDE: Linux (KDE); Open Source).
- ActiveState's Komodo (IDE: Windows, Linux, Mac; Commercial).
- MacGDBP (Standalone client for Mac OS X; Free)
- NetBeans (IDE: Windows, Linux, Mac OS X and Solaris).
- Notepad plugin (Editor: Windows).
- WaterProof's PHPEdit (IDE, from version 2.10: Windows; Commercial).
- PHPEclipse (Editor Plugin).
- Devsense's PHP Tools for Visual Studio (MS Visual Studio Plugin; Commercial).
- JetBrain's PhpStorm (IDE; Commercial).
- Protoeditor (Editor: Linux).
- pugdebug (Standalone client for Linux, Windows and Mac OS X; Open Source).
- VIM plugin (Editor Plugin).
- jcx software's VS.Php (MS Visual Studio Plugin; Commercial).
- Xdebug Chrome App (Chrome Application; Open Source)
- XDebugClient (Standalone client for Windows).
A simple command line tool for debugging is bundled in the debugclient directory where xdebug is located.
Start debugger
To enable the xdebug debugger, you need to configure some settings in php.ini. Such settings include xdebug.remote_enable to enable the debugger, xdebug.remote_host and xdebug.remote_port to configure the IP address and port for the debugger to connect. There is also the xdebug.remote_connect_back setting for sharing the development server with multiple developers.
If you need the debugger to initiate a session when an error occurs (PHP error or exception), you also need to change the xdebug.remot_mode setting. Allowed values for this setting are "req" (default), which causes the heightener to initiate a session at the beginning of the script, or "jit", which causes the session value to be generated when an error occurs.
After setting all this up, xdebug still fails to automatically start a debugging session as soon as the script is run. You have three ways to activate the xdebug debugger:
1. When running the script in the command line, you need to set the environment variable:
export XDEBUG_CONFIG="idekey=session_name"
php myscript.php
You can also configure xdebug.remote_host, xdebug.remote_port, xdebug.remote_mode and xdebug.remote_handler as the same environment variables by isolating these values in a space:
export XDEBUG_CONFIG="idekey=session_name remote_host=localhost profiler_enable=1"
All settings you can set through XDEBUG_CONFIG in php.ini.
2. If you want to debug the script in the browser, just add XDEBUG_SESSION_START=session_name参数 to the URL. To replace the GET parameter, you can also set XDEBUG_SESSTION_START as the POST parameter or the COOKIE parameter. Please refer to the next chapter for details.
3. To run PHP in the browser and activate the debugger, you need to install the following browser plug-in. Each plug-in lets you launch the debugger with the click of a button. When these plugins are activated, they will directly set the XDEBUG_SESSION cookie value instead of XDEBUG_SESSION_START.
The easiest Xdebug
The Firefox plug-in has an IDE interface for easier debugging. Plug-in address: https://addons.mozilla.org/en-US/firefox/addon/the-easiest-xdebug/.
Xdebug Helper for Chrome
The Chrome plug-in helps you turn on or off debugging with just one click. Plug-in address: https://chrome.google.com/extensions/detail/eadndfjplgieldjbigjakmdgkmoaaaoc.
Xdebug Toggler for Safari
The Safari plug-in can automatically enable Xdebug debugging. Github address: https://github.com/benmatselby/xdebug-toggler.
Xdebug launcher for Opera
The Opera plug-in allows you to open an xdebug debugging session.
Before you run the script, you want your client to be able to receive debug connections. Please refer to the article to specify how the client needs to be configured. To use the bundled simple client please refer to the Compilation and Installation chapter. You can use the branch "debug client".
When the debug client starts, it will display the following message and wait for the connection to be received by the debug server:
Xdebug Simple DBGp client (0.10.0)
Copyright 2002-2007 by Derick Rethans.
- libedit support: enabled
Waiting for debug server to connect.
When the connection is formed, the debug server will output the following information:
Connect
xmlns:xdebug="http://xdebug.org/dbgp/xdebug" fileuri="file:///home/httpd/www.xdebug.org/html/docs/index.php" language="PHP" protocol_version="1.0" appid="13202" idekey="derick">
(cmd)
Now you can use some command sets related to DBGp. When the script finishes running, the debugging server closes the connection with the client. The debug client resumes waiting for new connections.
Communication Settings
Static IP/single development
During remote debugging, xdebug built into PHP acts as the client, and the IDE acts as the server. The following animation shows the establishment of a communication channel:
- The server IP is 10.0.1.2, HTTP port 80
- The IP where the IDE is located is 10.0.1.42, so xdebug.remote_host is set to 10.0.1.42
- The IDE listens on port 9000, so xdebug.remote_port is set to 9000
- HTTP requests are initiated on the machine where the IDE is located.
- Xdebug connects to 10.0.1.42:9000
- Debugging starts and HTTP response is provided.
Unknown IP/Multiple developers
If xdebug.remote_connect_back is used, the connection method is slightly different:
- Server IP and HTTP port 10.0.1.2:80
- The machine where the IDE is located has an unknown IP, so xdebug.remote_connect_back is set to 1.
- The IDE listens on port 9000, so xdebug.remote_port is set to 9000
- The HTTP request starts, and Xdebug obtains the IP address through the HTTP header.
- The IP (10.0.1.42) obtained by Xdebug connection is on port 9000
- Debug runs, HTTP provides response.
HTTP debugging session
Xdebug includes the function of using cookies to start a trace debugging session on the browser. The work is similar to the following steps:
- When the URL variable XDEBUG_SESSION_START=name is appended to the URL, or the same name value is passed in through POST - Xdebug sends a cookie value "XDEBUG_SESSION" and this value is the URL parameter XDEBUG_SESSION_START value. The cookie value is valid for 1 hour. The DBGp protocol also passes the same value to the "idekey" attribute within the initial packet when connecting to the debug client.
- XDEBUG_SESSION_START or XDEBUG_SESSION cookie Once set, Xdebug will try to connect to the debugging client.
- To stop a debugging session (and destroy accompanying cookies) simply add the URL parameter XDEBUG_SESSION_STOP. Xdebug then no longer attempts to create a connection to the highly debug client.
Multi-user debugging
Xdebug only allows an IP address specified during remote debugging to connect to xdebug.remote_host. It cannot connect back to the IP of the machine where the browser is running when the browser is running the test, unless you use xdebug.remote_connect_back.
If developers have various projects on the same (development) server, you can set each project through Apache's .htaccess function php_value xdebug.remote_host=10.0.0.5 and use the xdebug.remote_host setting.
There are two solutions here. First, you can use a DBGp proxy. As for how to use it, refer to the Debugging with multiple users chapter. You can download the agent software as part of the python remote debugging package at ActiveState's web site. More documentation is in the Komodo FAQ.
The second is to use the xdebug.remote_connect_back setting of xdebug 2.1.
Related settings
xdebug.extended_info
Type: integer, default value: 1
Control whether xdebug forcibly turns on the "extended_info" mode of the PHP parser, which allows Xdebug to perform file/line number breakpoint debugging on remote debugging. When tracing or profiling scripts you usually want to turn this option off because the arrays produced by PHP will increase by a third in size and slow down your script. This setting can only be set in php.ini, not in ini_set().
xdebug.idekey
Type: string, Default value: *complex*
Controls which IDE index values can be passed by xdebug to the DBGp debug processor. The default is based on setting the environment. First the environment setting DBGP_IDEKEY is considered, then USER and finally USERNAME. The default value will be the first environment variable found. If it is indeed not found, the setting is the default "". If this value is set, it usually overrides the environment variable value.
xdebug.remote_autostart
Type: boolean, Default value: 0
Generally speaking, you need to use a specified HTTP GET/POST variable to start remote debugging (refer to Remote Debugging). When set to 1, Xdebug will attempt to start a remote debugging session and attempt to connect to a client, even if the GET/POST/COOKIE variable does not exist.
xdebug.remote_connect_back
Type: boolean, Default value: 0, since Xdebug > 2.1
If the setting is in effect, the xdebug.remote_host setting will be ignored and Xdebug will try to connect to the client making the HTTP request. It checks the $_SERVER['REMOTE_ADDR'] variable and finds out the IP address used. Keep in mind that there is no effective filtering, anyone can start a debug session and connect to the server, even if their address does not match xdebug.remote_host.
xdebug.remote_cookie_expire_time
Type: integer, Default value: 3600, since Xdebug > 2.1
Used to increase or decrease the cookie existence time of the remote debugging session.
xdebug.remote_enable
Type: boolean, Default value: 0
This switch controls Xdebug's attempt to communicate with the debugging client by setting the xdebug.remote_host and xdebug.remote_port listening server and port. When set to 0, the script is simply run but the connection cannot be established.
xdebug.remote_handler
Type: string, Default: dbgp
Can be changed to 'php3' to use the old PHP3 style debugger output, 'gdb' to enable GDB similar to the debugger interface, or 'dbgp' to use the debugger protocol. DBGp protocol is the only supported protocol.
Note: Version 2.1 or above only supports 'dbgp' as the protocol.
xdebug.remote_log
Type: string, Default value:
If set to a value, it is used as filename to a file to which all remote debugger communications are logged. The file is always opened in append-mode, and will therefore not be overwritten by default. There is no concurrency protection available. The format of the file looks something like:
Log opened at 2007-05-27 14:28:15
-> bool xdebug_break() This function creates a debugging breakpoint at the specified line

Hot AI Tools

Undresser.AI Undress
AI-powered app for creating realistic nude photos

AI Clothes Remover
Online AI tool for removing clothes from photos.

Undress AI Tool
Undress images for free

Clothoff.io
AI clothes remover

AI Hentai Generator
Generate AI Hentai for free.

Hot Article

Hot Tools

Notepad++7.3.1
Easy-to-use and free code editor

SublimeText3 Chinese version
Chinese version, very easy to use

Zend Studio 13.0.1
Powerful PHP integrated development environment

Dreamweaver CS6
Visual web development tools

SublimeText3 Mac version
God-level code editing software (SublimeText3)

Hot Topics
 1371
1371
 52
52
 Working with Flash Session Data in Laravel
Mar 12, 2025 pm 05:08 PM
Laravel simplifies handling temporary session data using its intuitive flash methods. This is perfect for displaying brief messages, alerts, or notifications within your application. Data persists only for the subsequent request by default: $request-
 PHP Logging: Best Practices for PHP Log Analysis
Mar 10, 2025 pm 02:32 PM
PHP logging is essential for monitoring and debugging web applications, as well as capturing critical events, errors, and runtime behavior. It provides valuable insights into system performance, helps identify issues, and supports faster troubleshoot
 cURL in PHP: How to Use the PHP cURL Extension in REST APIs
Mar 14, 2025 am 11:42 AM
The PHP Client URL (cURL) extension is a powerful tool for developers, enabling seamless interaction with remote servers and REST APIs. By leveraging libcurl, a well-respected multi-protocol file transfer library, PHP cURL facilitates efficient execution of various network protocols, including HTTP, HTTPS, and FTP. This extension offers granular control over HTTP requests, supports multiple concurrent operations, and provides built-in security features.
 Simplified HTTP Response Mocking in Laravel Tests
Mar 12, 2025 pm 05:09 PM
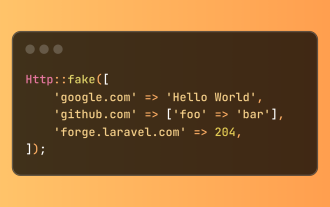
Laravel provides concise HTTP response simulation syntax, simplifying HTTP interaction testing. This approach significantly reduces code redundancy while making your test simulation more intuitive. The basic implementation provides a variety of response type shortcuts: use Illuminate\Support\Facades\Http; Http::fake([ 'google.com' => 'Hello World', 'github.com' => ['foo' => 'bar'], 'forge.laravel.com' =>
 12 Best PHP Chat Scripts on CodeCanyon
Mar 13, 2025 pm 12:08 PM
Do you want to provide real-time, instant solutions to your customers' most pressing problems? Live chat lets you have real-time conversations with customers and resolve their problems instantly. It allows you to provide faster service to your custom
 Explain the concept of late static binding in PHP.
Mar 21, 2025 pm 01:33 PM
Article discusses late static binding (LSB) in PHP, introduced in PHP 5.3, allowing runtime resolution of static method calls for more flexible inheritance.Main issue: LSB vs. traditional polymorphism; LSB's practical applications and potential perfo
 Alipay PHP SDK transfer error: How to solve the problem of 'Cannot declare class SignData'?
Apr 01, 2025 am 07:21 AM
Alipay PHP...
 Customizing/Extending Frameworks: How to add custom functionality.
Mar 28, 2025 pm 05:12 PM
The article discusses adding custom functionality to frameworks, focusing on understanding architecture, identifying extension points, and best practices for integration and debugging.


