
 Backend Development
PHP Tutorial
Using the GD library to draw a line chart in PHP How to draw a line chart
Backend Development
PHP Tutorial
Using the GD library to draw a line chart in PHP How to draw a line chart
Using the GD library to draw a line chart in PHP How to draw a line chart

This article introduces to you the use of GD library in PHP to draw line charts through code. It involves some simple uses of GD library in PHP. This article introduces it in great detail. Interested friends can learn together
In PHP In , there are some simple image functions that can be used directly, but most of the images to be processed require the GD library when compiling PHP. In addition to installing the GD library, other libraries may be required in PHP, depending on which image formats need to be supported. The GD library can be downloaded for free at http://www.boutell.com/gd/. Different GD versions support different image formats. The latest GD library version supports images in GIF, JPEG, PNG, WBMP, XBM and other formats. files, and also supports some font libraries such as FreeType and Type 1. Through the functions in the GD library, you can complete the operation and processing of various points, lines, geometric figures, text and colors, and you can also create or read image files in various formats.
In PHP, image processing operations through the GD library are first processed in memory. After the operation is completed, it is output to the browser or saved on the server's disk in the form of a file stream. Creating an image should be done in 4 basic steps as shown below.
(1) Create canvas: All drawing designs need to be completed on a background image, and the canvas is actually a temporary area opened up in the memory to store image information. All future image operations will be based on this background canvas, and the management of this canvas is similar to the canvas we use when painting.
(2) Draw an image: After the canvas is created, you can use this canvas resource to set the color of the image, fill the canvas, draw points, line segments, various geometric figures, and add to the image using various portrait functions. Add text, etc.
(3) Output image: After completing the drawing of the entire image, the image needs to be saved in a certain format to a file specified by the server, or the image needs to be output directly to the browser for display to the user. But before the image is output, you must use the header() function to send the Content-type to notify the browser. This time, the image is sent instead of text.
(4) Release resources: After the image is output, the content in the canvas is no longer useful. In order to save system resources, all memory resources occupied by the canvas need to be cleared in time.
Use GD to draw a line chart in php, the code is as follows:
Class Chart{
  private $image; // 定义图像
  private $title; // 定义标题
  private $ydata; // 定义Y轴数据
  private $xdata; // 定义X轴数据
  private $seriesName; // 定义每个系列数据的名称
  private $color; // 定义条形图颜色
  private $bgcolor; // 定义图片背景颜色
  private $width; // 定义图片的宽
  private $height; // 定义图片的长
  /*
  * 构造函数
  * String title 图片标题
  * Array xdata 索引数组,X轴数据
  * Array ydata 索引数组,数字数组,Y轴数据
  * Array series_name 索引数组,数据系列名称
  */
  function __construct($title,$xdata,$ydata,$seriesName) {
   $this->title = $title;
   $this->xdata = $xdata;
   $this->ydata = $ydata;
   $this->seriesName = $seriesName;
   $this->color = array('#DC', '#B', '#EDB', '#DDDF', '#CBE', '#E', '#FF', '#FFF', '#AFC');
  }
  /*
  * 公有方法,设置条形图的颜色
  * Array color 颜色数组,元素取值为'#DC'这种形式
  */
  function setBarColor($color){
   $this->color = $color;
  }
 /*
  * 绘制折线图
  */
  public function paintLineChart() {
   $ydataNum = $this->arrayNum($this->ydata); // 取得数据分组的个数
   $max = $this->arrayMax($this->ydata); // 取得所有呈现数据的最大值
   $max = ($max > )? $max : ;
   $multi = $max/; // 如果最大数据是大于的则进行缩小处理
   $barHeightMulti = .; // 条形高缩放的比例
   $lineWidth = ;
   $chartLeft = (+strlen($max))*; // 设置图片左边的margin
   $lineY = ; // 初始化条形图的Y的坐标
   // 设置图片的宽、高
   //$this->width = $lineWidth*count($this->xdata) + $chartLeft - $lineWidth/.;
   $margin = ; // 小矩形描述右边margin
   $recWidth = ; // 小矩形的宽
   $recHeight = ; // 小矩形的高
   $space = ; // 小矩形与条形图的间距
   $tmpWidth = ;
   // 设置图片的宽、高
   $lineChartWidth = $lineWidth*count($this->xdata) + $chartLeft - $lineWidth/. ;
   // 两个系列数据以上的加上小矩形的宽
   if($ydataNum > ) {
    $tmpWidth = $this->arrayLengthMax($this->seriesName)**/ + $space + $recWidth + + $margin;
   }
   $this->width = $lineChartWidth + $tmpWidth;
   $this->height = ;
   $this->image = imagecreatetruecolor($this->width ,$this->height); // 准备画布
   $this->bgcolor = imagecolorallocate($this->image,,,); // 图片的背景颜色
   // 设置条形图的颜色
   $color = array();
   foreach($this->color as $col) {
    $col = substr($col,,strlen($col)-);
    $red = hexdec(substr($col,,));
    $green = hexdec(substr($col,,));
    $blue = hexdec(substr($col,,));
    $color[] = imagecolorallocate($this->image ,$red, $green, $blue);
   }
   // 设置线段的颜色、字体的颜色、字体的路径
   $lineColor = imagecolorallocate($this->image ,xcc,xcc,xcc);
   $fontColor = imagecolorallocate($this->image, x,xf,xf);
   $fontPath = 'font/simsun.ttc';
   imagefill($this->image,,,$this->bgcolor); // 绘画背景
   // 绘画图的分短线与左右边线
   for($i = ; $i < ; $i++ ) {
    imageline($this->image,$chartLeft-,$lineY-$barHeightMulti*$max//$multi*$i,$lineChartWidth,$lineY-$barHeightMulti*$max//$multi*$i,$lineColor);
    imagestring($this->image,,,$lineY-$barHeightMulti*$max//$multi*$i-,floor($max/*$i),$fontColor);
   }
   imageline($this->image,$chartLeft-,,$chartLeft-,$lineY,$lineColor);
   imageline($this->image,$lineChartWidth-,,$lineChartWidth-,$lineY,$lineColor);
   $style = array($lineColor,$lineColor,$lineColor,$lineColor,$lineColor,$this->bgcolor,$this->bgcolor,$this->bgcolor,$this->bgcolor,$this->bgcolor);
   imagesetstyle($this->image,$style);
   // 绘制折线图的分隔线(虚线)
   foreach($this->xdata as $key => $val) {
     $lineX = $chartLeft + + $lineWidth*$key;
     imageline($this->image,$lineX,,$lineX,$lineY,IMG_COLOR_STYLED);
   }
   // 绘画图的折线
   foreach($this->ydata as $key => $val) {
    if($ydataNum == ) {
     // 一个系列数据时
     if($key == count($this->ydata) - ) break;
     $lineX = $chartLeft + + $lineWidth*$key;
     $lineY = $lineY-$barHeightMulti*($this->ydata[$key+])/$multi;
     // 画折线
     if($key == count($this->ydata) - ) {
      imagefilledellipse($this->image,$lineX+$lineWidth,$lineY,,,$color[]);
     }
     imageline($this->image,$lineX,$lineY-$barHeightMulti*$val/$multi,$lineX+$lineWidth,$lineY,$color[]);
     imagefilledellipse($this->image,$lineX,$lineY-$barHeightMulti*$val/$multi,,,$color[]);
    }elseif($ydataNum > ) {
     // 多个系列的数据时
     foreach($val as $ckey => $cval) {
      if($ckey == count($val) - ) break;
      $lineX = $chartLeft + + $lineWidth*$ckey;
      $lineY = $lineY-$barHeightMulti*($val[$ckey+])/$multi;
      // 画折线
      if($ckey == count($val) - ) {
       imagefilledellipse($this->image,$lineX+$lineWidth,$lineY,,,$color[$key%count($this->color)]);
      }
      imageline($this->image,$lineX,$lineY-$barHeightMulti*$cval/$multi,$lineX+$lineWidth,$lineY,$color[$key%count($this->color)]);
      imagefilledellipse($this->image,$lineX,$lineY-$barHeightMulti*$cval/$multi,,,$color[$key%count($this->color)]);
     }
    }
   }
   // 绘画条形图的x坐标的值
   foreach($this->xdata as $key => $val) {
    $lineX = $chartLeft + $lineWidth*$key + $lineWidth/ - ;
    imagettftext($this->image,,-,$lineX,$lineY+,$fontColor,$fontPath,$this->xdata[$key]);
   }
   // 两个系列数据以上时绘制小矩形及之后文字说明
   if($ydataNum > ) {
    $x = $lineChartWidth + $space;
    $y = ;
    foreach($this->seriesName as $key => $val) {
     imagefilledrectangle($this->image,$x,$y,$x+$recWidth,$y+$recHeight,$color[$key%count($this->color)]);
     imagettftext($this->image,,,$x+$recWidth+,$y+$recHeight-,$fontColor,$fontPath,$this->seriesName[$key]);
     $y += $recHeight + ;
    }
   }
   // 绘画标题
   $titleStart = ($this->width - .*strlen($this->title))/;
   imagettftext($this->image,,,$titleStart,,$fontColor,$fontPath,$this->title);
   // 输出图片
   header("Content-Type:image/png");
   imagepng ( $this->image );
  }
  /*
  * 私有方法,当数组为二元数组时,统计数组的长度
  * Array arr 要做统计的数组
  */
  private function arrayNum($arr) {
   $num = ;
   if(is_array($arr)) {
    $num++;
    for($i = ; $i < count($arr); $i++){
     if(is_array($arr[$i])) {
      $num = count($arr);
      break;
     }
    }
   }
   return $num;
  }
  /*
  * 私有方法,计算数组的深度
  * Array arr 数组
  */
  private function arrayDepth($arr) {
   $num = ;
   if(is_array($arr)) {
    $num++;
    for($i = ; $i < count($arr); $i++){
     if(is_array($arr[$i])) {
      $num += $this->arrayDepth($arr[$i]);
      break;
     }
    }
   }
   return $num;
  }
  /*
  * 私有方法,找到一组中的最大值
  * Array arr 数字数组
  */
  private function arrayMax($arr) {
   $depth = $this->arrayDepth($arr);
   $max = ;
   if($depth == ) {
    rsort($arr);
    $max = $arr[];
   }elseif($depth > ) {
    foreach($arr as $val) {
     if(is_array($val)) {
      if($this->arrayMax($val) > $max) {
       $max = $this->arrayMax($val);
      }
     }else{
      if($val > $max){
       $max = $val;
      }
     }
    }
   }
   return $max;
  }
  /*
  * 私有方法,求数组的平均值
  * Array arr 数字数组
  */
  function arrayAver($arr) {
   $aver = array();
   foreach($arr as $val) {
    if(is_array($val)) {
     $aver = array_merge($aver,$val);
    }else{
     $aver[] = $val;
    }
   }
   return array_sum($aver)/count($aver);
  }
  /*
  * 私有方法,求数组中元素长度最大的值
  * Array arr 字符串数组,必须是汉字
  */
  private function arrayLengthMax($arr) {
   $length = ;
   foreach($arr as $val) {
    $length = strlen($val) > $length ? strlen($val) : $length;
   }
   return $length/;
  }
  // 析构函数
  function __destruct(){
   imagedestroy($this->image);
  }
}The test code is as follows:
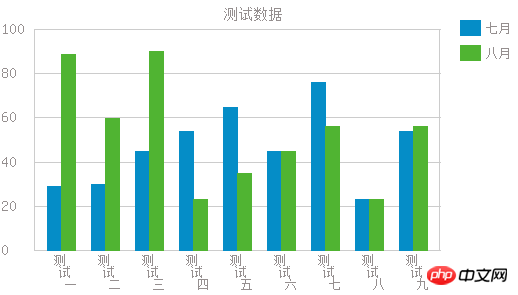
 $xdata = array('测试一','测试二','测试三','测试四','测试五','测试六','测试七','测试八','测试九');
 $ydata = array(array(,,,,,,,,),array(,,,,,,,,));
 $color = array();
 $seriesName = array("七月","八月");
 $title = "测试数据";
 $Img = new Chart($title,$xdata,$ydata,$seriesName);
$Img->paintLineChart();The rendering is as follows:
Go to this code Finish.
The following will introduce to you some simple uses of the GD library in php
Today I learned some simple uses of the GD library, and now I will make a summary!
What is the GD library? , graphic device, image tool library, gd library is an extension library for PHP to process graphics. The gd library provides a series of APIs for processing pictures. You can use the GD library to process pictures or generate pictures. On websites, the GD library is usually used to generate thumbnails or to add watermarks to images or to generate reports on website data.
php is not limited to outputting HTML text. By using the GD extension library, PHP can also be used to dynamically output images, such as text buttons, verification codes, data charts, etc. Ha can easily edit images, try to process thumbnails and add watermarks to pictures, etc., and has powerful image processing capabilities.
First of all, let’s talk about the GD library and some steps to draw a simple graphic:
1. First, create the canvas. Here we use the imagecreatetruecolor function, or you can Using imagecreate, the difference is that the former creates a true color image, and the latter creates a palette-based image
$img=imagecreatetruecolor(100,100), which has two parameters corresponding to the image we created The width and height of Using the imagecolorallocate function
Here we define more required colors$white=imagecolorallocate($img,0xFF,0xFF,0xFF)或者可以使用RGB的颜色命名方式 如$white=imagecolorallocate($img,255,255,255); $gray = imagecolorallocate($img, 0xC0, 0xC0, 0xC0); $darkgray = imagecolorallocate($img, 0x90, 0x90, 0x90); $navy = imagecolorallocate($img, 0x00, 0x00, 0x80); $darknavy = imagecolorallocate($img, 0x00, 0x00, 0x50); $red = imagecolorallocate($img, 0xFF, 0x00, 0x00); $darkred = imagecolorallocate($img, 0x90, 0x00, 0x00); $black=imagecolorallocate($img,0x00,0x00,0x00);
3. Fill area color, which can be easily understood To fill the background color of the image, use the imagefill function
imagefill($img,0,0,$white), where 0 0 means filling the background color starting from coordinates x y
4 , To draw graphics, such as pie charts, what is needed is the imagefilledarc function
imagefilledarc() has relatively many parameters, such as imagefilledarc($img,50,$i,100,50,0 ,45,$red,IMG_ARC_PIE);
which respectively means drawing an arc on the red color word img image starting from 50,$i and drawing an arc within the range of 0 to 45 angles
5. During this period, we can also add some explanation questions, such as adding a string horizontally, using imagestring($img,1,20,40,"hello,world!",$red), which means that in the img picture, 20 40 is the coordinate, write a red hello, world! Words
6. When it comes to image output
, you must first tell the browser what image format you want to output. For example, if you want to output png, use header("Content-type:image/png ");
Secondly, output the image to the browser, imagepng($img);
Finally, destroy the image, that is, release the memory occupied by the image storage imagedestroy(img);,

Hot AI Tools

Undresser.AI Undress
AI-powered app for creating realistic nude photos

AI Clothes Remover
Online AI tool for removing clothes from photos.

Undress AI Tool
Undress images for free

Clothoff.io
AI clothes remover

Video Face Swap
Swap faces in any video effortlessly with our completely free AI face swap tool!

Hot Article
Hot Tools

Notepad++7.3.1
Easy-to-use and free code editor

SublimeText3 Chinese version
Chinese version, very easy to use

Zend Studio 13.0.1
Powerful PHP integrated development environment

Dreamweaver CS6
Visual web development tools

SublimeText3 Mac version
God-level code editing software (SublimeText3)
Hot Topics
 1390
1390
 52
52

 Alipay PHP SDK transfer error: How to solve the problem of 'Cannot declare class SignData'?
Apr 01, 2025 am 07:21 AM
Alipay PHP SDK transfer error: How to solve the problem of 'Cannot declare class SignData'?
Apr 01, 2025 am 07:21 AM
Alipay PHP...
 Explain JSON Web Tokens (JWT) and their use case in PHP APIs.
Apr 05, 2025 am 12:04 AM
Explain JSON Web Tokens (JWT) and their use case in PHP APIs.
Apr 05, 2025 am 12:04 AM
JWT is an open standard based on JSON, used to securely transmit information between parties, mainly for identity authentication and information exchange. 1. JWT consists of three parts: Header, Payload and Signature. 2. The working principle of JWT includes three steps: generating JWT, verifying JWT and parsing Payload. 3. When using JWT for authentication in PHP, JWT can be generated and verified, and user role and permission information can be included in advanced usage. 4. Common errors include signature verification failure, token expiration, and payload oversized. Debugging skills include using debugging tools and logging. 5. Performance optimization and best practices include using appropriate signature algorithms, setting validity periods reasonably,
 How does session hijacking work and how can you mitigate it in PHP?
Apr 06, 2025 am 12:02 AM
How does session hijacking work and how can you mitigate it in PHP?
Apr 06, 2025 am 12:02 AM
Session hijacking can be achieved through the following steps: 1. Obtain the session ID, 2. Use the session ID, 3. Keep the session active. The methods to prevent session hijacking in PHP include: 1. Use the session_regenerate_id() function to regenerate the session ID, 2. Store session data through the database, 3. Ensure that all session data is transmitted through HTTPS.
 Describe the SOLID principles and how they apply to PHP development.
Apr 03, 2025 am 12:04 AM
Describe the SOLID principles and how they apply to PHP development.
Apr 03, 2025 am 12:04 AM
The application of SOLID principle in PHP development includes: 1. Single responsibility principle (SRP): Each class is responsible for only one function. 2. Open and close principle (OCP): Changes are achieved through extension rather than modification. 3. Lisch's Substitution Principle (LSP): Subclasses can replace base classes without affecting program accuracy. 4. Interface isolation principle (ISP): Use fine-grained interfaces to avoid dependencies and unused methods. 5. Dependency inversion principle (DIP): High and low-level modules rely on abstraction and are implemented through dependency injection.
 How to automatically set permissions of unixsocket after system restart?
Mar 31, 2025 pm 11:54 PM
How to automatically set permissions of unixsocket after system restart?
Mar 31, 2025 pm 11:54 PM
How to automatically set the permissions of unixsocket after the system restarts. Every time the system restarts, we need to execute the following command to modify the permissions of unixsocket: sudo...
 How to debug CLI mode in PHPStorm?
Apr 01, 2025 pm 02:57 PM
How to debug CLI mode in PHPStorm?
Apr 01, 2025 pm 02:57 PM
How to debug CLI mode in PHPStorm? When developing with PHPStorm, sometimes we need to debug PHP in command line interface (CLI) mode...
 Explain late static binding in PHP (static::).
Apr 03, 2025 am 12:04 AM
Explain late static binding in PHP (static::).
Apr 03, 2025 am 12:04 AM
Static binding (static::) implements late static binding (LSB) in PHP, allowing calling classes to be referenced in static contexts rather than defining classes. 1) The parsing process is performed at runtime, 2) Look up the call class in the inheritance relationship, 3) It may bring performance overhead.
 How to send a POST request containing JSON data using PHP's cURL library?
Apr 01, 2025 pm 03:12 PM
How to send a POST request containing JSON data using PHP's cURL library?
Apr 01, 2025 pm 03:12 PM
Sending JSON data using PHP's cURL library In PHP development, it is often necessary to interact with external APIs. One of the common ways is to use cURL library to send POST�...
