 Backend Development
 PHP Tutorial
 PHP performance analysis tool XHProf installation and usage tutorial_PHP tutorial
PHP performance analysis tool XHProf installation and usage tutorial_PHP tutorial
PHP performance analysis tool XHProf installation and usage tutorial
This article mainly introduces the PHP performance analysis tool XHProf installation and usage tutorial. This article gives detailed installation steps, configuration methods and usage examples. , friends in need can refer to it
HProf is a PHP lightweight performance analysis tool open sourced by Facebook. It is similar to Xdebug, but has lower performance overhead. It can also be used in production environments, and can also be controlled by program switches whether to profile. Based on browsing
The performance analysis user interface of the server makes it easier to view or share results with peers. Call graphs can also be drawn. During the data collection phase, it records the number of calls traced and the inclusion of metric arcs in a dynamic callgraph of a program.
Its unique reporting/post-processing stage of data calculation. During data collection, XHProfd handles recursive function calls by detecting loops and avoids infinite loops by giving each deep call in the recursive call a useful name.
The lightweight nature and aggregation capabilities of XHProf make it ideal for collecting performance statistics for "production environments".
1. Install XHProf
The code is as follows:
wget http://pecl.php.net/get/xhprof-0.9.2.tgz
tar zxf xhprof-0.9.2.tgz
cd xhprof-0.9.2
cp -r xhprof_html xhprof_lib
cd extension
phpize
./configure
make
make install
2. Configure php.ini file
The code is as follows:
[xhprof]
extension=xhprof.so
;
; directory used by default implementation of the iXHProfRuns
; interface (namely, the XHProfRuns_Default class) for storing
; XHProf runs.
; Remember
xhprof.output_dir=
Restart the service to make the changes take effect. You can now use XHProf. However, in order to make the display more dazzling, it is best to continue to install Graphviz.
3. Install Graphviz
The code is as follows:
wget http://www.graphviz.org/pub/graphviz/stable/SOURCES/graphviz-2.26.3.tar.gz
tar zxf graphviz-2.26.3.tar.gz
cd graphviz-2.26.3
./configure
make
make install
After the installation is completed, the /usr/local/bin/dot file will be generated. You should ensure that the path is in the PATH environment variable so that XHProf can find it.
4. Apply XHProf
Copy the code. The code is as follows:
xhprof_enable();//Open xhprof
/******Program Logic Start******/
Function test1(){
sleep(3);
return;
}
Function test2(){
test1();
}
Function test3(){
test2();
}
Function p(){
echo '
xhprof test
';
}
p();
test3();
/******Program logic End******/
$xhprof_data = xhprof_disable();//Close xhprof
//Save xhprof data
include_once '../xhprof_lib/utils/xhprof_lib.php';
include_once '../xhprof_lib/utils/xhprof_runs.php';
$xhprof_runs = new XHProfRuns_Default();
$xhprof_source = 'xhprof_test';
$run_id = $xhprof_runs->save_run($xhprof_data, $xhprof_source);
$report_url = 'http://xhprof.rebill.info/index.php?run='.$run_id.'&source='.$xhprof_source;
echo '
';
echo 'view the performance report:'.$report_url.'';
In this way, a data file with a name similar to 4c236583ef490.xhprof_test will be generated in the xhprof.output_dir directory set above, and the effect can be easily browsed through the Web:
http://xhprof.rebill.info/index.php?run=4c236583ef490&source=xhprof_test
The current display is in tabular form. Click [View Full Callgraph] on the page to see the exquisite picture display.
Online test experience address: http://xhprof.rebill.info/test.php

Hot AI Tools

Undresser.AI Undress
AI-powered app for creating realistic nude photos

AI Clothes Remover
Online AI tool for removing clothes from photos.

Undress AI Tool
Undress images for free

Clothoff.io
AI clothes remover

AI Hentai Generator
Generate AI Hentai for free.

Hot Article

Hot Tools

Notepad++7.3.1
Easy-to-use and free code editor

SublimeText3 Chinese version
Chinese version, very easy to use

Zend Studio 13.0.1
Powerful PHP integrated development environment

Dreamweaver CS6
Visual web development tools

SublimeText3 Mac version
God-level code editing software (SublimeText3)

Hot Topics
 CakePHP Project Configuration
Sep 10, 2024 pm 05:25 PM
In this chapter, we will understand the Environment Variables, General Configuration, Database Configuration and Email Configuration in CakePHP.
 PHP 8.4 Installation and Upgrade guide for Ubuntu and Debian
Dec 24, 2024 pm 04:42 PM
PHP 8.4 brings several new features, security improvements, and performance improvements with healthy amounts of feature deprecations and removals. This guide explains how to install PHP 8.4 or upgrade to PHP 8.4 on Ubuntu, Debian, or their derivati
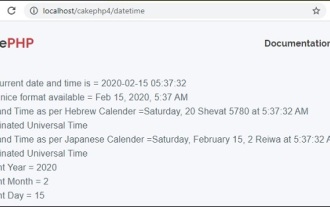
 CakePHP Date and Time
Sep 10, 2024 pm 05:27 PM
To work with date and time in cakephp4, we are going to make use of the available FrozenTime class.
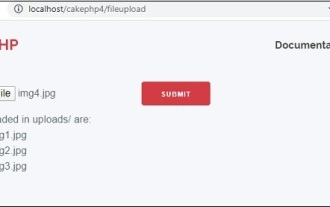
 CakePHP File upload
Sep 10, 2024 pm 05:27 PM
To work on file upload we are going to use the form helper. Here, is an example for file upload.
 CakePHP Routing
Sep 10, 2024 pm 05:25 PM
In this chapter, we are going to learn the following topics related to routing ?
 Discuss CakePHP
Sep 10, 2024 pm 05:28 PM
CakePHP is an open-source framework for PHP. It is intended to make developing, deploying and maintaining applications much easier. CakePHP is based on a MVC-like architecture that is both powerful and easy to grasp. Models, Views, and Controllers gu
 CakePHP Working with Database
Sep 10, 2024 pm 05:25 PM
Working with database in CakePHP is very easy. We will understand the CRUD (Create, Read, Update, Delete) operations in this chapter.
 CakePHP Creating Validators
Sep 10, 2024 pm 05:26 PM
Validator can be created by adding the following two lines in the controller.


