 Backend Development
 PHP Tutorial
 Use GDB to debug PHP code and solve the problem of infinite loop in PHP code_PHP tutorial
Use GDB to debug PHP code and solve the problem of infinite loop in PHP code_PHP tutorial
Use GDB to debug PHP code and solve the problem of infinite loop of PHP code
Recently, when I was helping my colleagues solve the Swoole Server problem, I found that 1 worker process has been in R state, and The CPU consumption is very high. The preliminary conclusion is that an infinite loop occurs in the PHP code.
The following code shows how to solve the PHP infinite loop problem.
The code is as follows:
#dead_loop.php
$array = array();
for($i = 0; $i < 10000; $i++)
{
$array[] = $i;
}
include __DIR__."/include.php";
#include.php
while(1)
{
usleep(10);
$keys = array_flip($array);
$index = array_search(rand(1500, 9999), $array);
$str = str_repeat('A', $index);
$strb = test($index, $str);
}
function test($index, $str)
{
return str_replace('A', 'B', $str);
}
Get the process ID and status through ps aux as follows, use gdb -p process ptrace tracking, and get the call stack through the bt command
The code is as follows:
htf 3834 2.6 0.2 166676 22060 pts/12 R+ 10:50 0:12 php dead_loop.php
gdb -p 3834
(gdb) bt
#0 0x00000000008cc03f in zend_mm_check_ptr (heap=0x1eaa2c0, ptr=0x2584910, silent=1, __zend_filename=0xee3d40 "/home/htf/workspace/php-5.4.27/Zend/zend_variables.c",
__zend_lineno=182, __zend_orig_filename=0xee1888 "/home/htf/workspace/php-5.4.27/Zend/zend_execute_API.c", __zend_orig_lineno=437)
at /home/htf/workspace/php-5.4.27/Zend/zend_alloc.c:1485
#1 0x000000008cd643 in _zend_mm_free_int (heap = 0x1eaa2c0, P = 0x2584910, __ZEND_FILENAME = 0xee3d40 "/HOMESPACE/php-5.4.27/zend_v ariables.c ", __zend_lineno = 182,
__zend_orig_filename=0xee1888 "/home/htf/workspace/php-5.4.27/Zend/zend_execute_API.c", __zend_orig_lineno=437) at /home/htf/workspace/php-5.4.27/Zend/zend_alloc.c:2064
#2 0x00000000008cebf7 in _efree (ptr=0x2584910, __zend_filename=0xee3d40 "/home/htf/workspace/php-5.4.27/Zend/zend_variables.c", __zend_lineno=182,
__zend_orig_filename=0xee1888 "/home/htf/workspace/php-5.4.27/Zend/zend_execute_API.c", __zend_orig_lineno=437) at /home/htf/workspace/php-5.4.27/Zend/zend_alloc.c:2436
#3 0x00000000008eda0a in _zval_ptr_dtor (zval_ptr=0x25849a0, __zend_filename=0xee3d40 "/home/htf/workspace/php-5.4.27/Zend/zend_variables.c", __zend_lineno=182)
at /home/htf/workspace/php-5.4.27/Zend/zend_execute_API.c:437
#4 0x00000000008fe687 in _zval_ptr_dtor_wrapper (zval_ptr=0x25849a0) at /home/htf/workspace/php-5.4.27/Zend/zend_variables.c:182
#5 0x000000000091259f in zend_hash_destroy (ht=0x7f7263f6e380) at /home/htf/workspace/php-5.4.27/Zend/zend_hash.c:560
#6 0x00000000008fe2c5 in _zval_dtor_func (zvalue=0x7f726426fe50, __zend_filename=0xeea290 "/home/htf/workspace/php-5.4.27/Zend/zend_execute.c", __zend_lineno=901)
at /home/htf/workspace/php-5.4.27/Zend/zend_variables.c:45
#7 0x0000000000936656 in _zval_dtor (zvalue=0x7f726426fe50, __zend_filename=0xeea290 "/home/htf/workspace/php-5.4.27/Zend/zend_execute.c", __zend_lineno=901)
at /home/htf/workspace/php-5.4.27/Zend/zend_variables.h:35
#8 0x0000000000939747 in zend_assign_to_variable (variable_ptr_ptr=0x7f7263f8e738, value=0x7f726426f6a8) at /home/htf/workspace/php-5.4.27/Zend/zend_execute.c:901
#9 0x0000000000997ee5 in ZEND_ASSIGN_SPEC_CV_VAR_HANDLER (execute_data=0x7f726d04b2a8) at /home/htf/workspace/php-5.4.27/Zend/zend_vm_execute.h:33168
#10 0x000000000093b5fd in execute (op_array=0x21d58b0) at /home/htf/workspace/php-5.4.27/Zend/zend_vm_execute.h:410
#11 0x0000000000901692 in zend_execute_scripts (type=8, retval=0x0, file_count=3) at /home/htf/workspace/php-5.4.27/Zend/zend.c:1315
#12 0x000000000087926a in php_execute_script (primary_file=0x7ffffe0038d0) at /home/htf/workspace/php-5.4.27/main/main.c:2502
#13 0x00000000009a32e3 in do_cli (argc=2, argv=0x7ffffe004d18) at /home/htf/workspace/php-5.4.27/sapi/cli/php_cli.c:989
#14 0x00000000009a4491 in main (argc=2, argv=0x7ffffe004d18) at /home/htf/workspace/php-5.4.27/sapi/cli/php_cli.c:1365
After executing gdb, the endless loop process will change to T status, indicating that it is Trace. This is exclusive, so you can no longer use strace/gdb or other ptrace tools to debug this process. Additionally this process will interrupt execution. After gdb enters c, the program continues to run downward. Then press ctrl+c again to interrupt the program. View the call stack of the process through the bt command.
The code is as follows:
(gdb) bt
#0 _zend_mm_alloc_int (heap=0x1eaa2c0, size=72, __zend_filename=0xe43410 "/home/htf/workspace/php-5.4.27/ext/standard/array.c", __zend_lineno=2719,
__zend_orig_filename=0xee5a38 "/home/htf/workspace/php-5.4.27/Zend/zend_hash.c", __zend_orig_lineno=412) at /home/htf/workspace/php-5.4.27/Zend/zend_alloc.c:1895
#1 0x00000000008ceb86 in _emalloc (size=72, __zend_filename=0xe43410 "/home/htf/workspace/php-5.4.27/ext/standard/array.c", __zend_lineno=2719,
__zend_orig_filename=0xee5a38 "/home/htf/workspace/php-5.4.27/Zend/zend_hash.c", __zend_orig_lineno=412) at /home/htf/workspace/php-5.4.27/Zend/zend_alloc.c:2425
#2 0x0000000000911d85 in _zend_hash_index_update_or_next_insert (ht=0x2257a10, h=3972, pData=0x7ffffe0012b0, nDataSize=8, pDest=0x0, flag=1,
__zend_filename=0xe43410 "/home/htf/workspace/php-5.4.27/ext/standard/array.c", __zend_lineno=2719) at /home/htf/workspace/php-5.4.27/Zend/zend_hash.c:412
#3 0x00000000007767e1 in zif_array_flip (ht=1, return_value=0x7f726424ea68, return_value_ptr=0x0, this_ptr=0x0, return_value_used=1)
at /home/htf/workspace/php-5.4.27/ext/standard/array.c:2719
#4 0x000000000093c03e in zend_do_fcall_common_helper_SPEC (execute_data=0x7f726d04b2a8) at /home/htf/workspace/php-5.4.27/Zend/zend_vm_execute.h:643
#5 0x00000000009400e6 in ZEND_DO_FCALL_SPEC_CONST_HANDLER (execute_data=0x7f726d04b2a8) at /home/htf/workspace/php-5.4.27/Zend/zend_vm_execute.h:2233
#6 0x000000000093b5fd in execute (op_array=0x21d58b0) at /home/htf/workspace/php-5.4.27/Zend/zend_vm_execute.h:410
两次的BT信息不一样,这是因为程序在不同的位置中断。看到execute (oparray=0x21d58b0) 这一行,这里就是PHP执行oparray的入口了。gdb下输入f 6,(通过调用栈编号可得)。
代码如下:
(gdb) f 6
#6 0x000000000093b5fd in execute (op_array=0x21d58b0) at /home/htf/workspace/php-5.4.27/Zend/zend_vm_execute.h:410
410 if ((ret = OPLINE->handler(execute_data TSRMLS_CC)) > 0) {
(gdb) p *op_array
$2 = {type = 2 '

Hot AI Tools

Undresser.AI Undress
AI-powered app for creating realistic nude photos

AI Clothes Remover
Online AI tool for removing clothes from photos.

Undress AI Tool
Undress images for free

Clothoff.io
AI clothes remover

AI Hentai Generator
Generate AI Hentai for free.

Hot Article

Hot Tools

Notepad++7.3.1
Easy-to-use and free code editor

SublimeText3 Chinese version
Chinese version, very easy to use

Zend Studio 13.0.1
Powerful PHP integrated development environment

Dreamweaver CS6
Visual web development tools

SublimeText3 Mac version
God-level code editing software (SublimeText3)

Hot Topics
 1376
1376
 52
52
 PHP 8.4 Installation and Upgrade guide for Ubuntu and Debian
Dec 24, 2024 pm 04:42 PM
PHP 8.4 brings several new features, security improvements, and performance improvements with healthy amounts of feature deprecations and removals. This guide explains how to install PHP 8.4 or upgrade to PHP 8.4 on Ubuntu, Debian, or their derivati
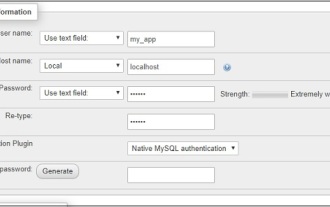 CakePHP Working with Database
Sep 10, 2024 pm 05:25 PM
Working with database in CakePHP is very easy. We will understand the CRUD (Create, Read, Update, Delete) operations in this chapter.
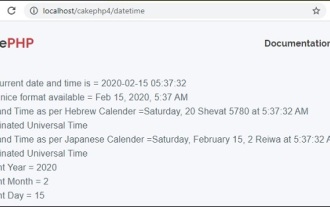 CakePHP Date and Time
Sep 10, 2024 pm 05:27 PM
To work with date and time in cakephp4, we are going to make use of the available FrozenTime class.
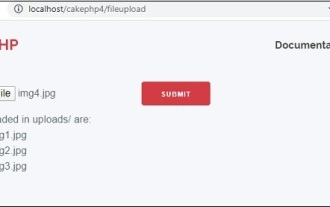 CakePHP File upload
Sep 10, 2024 pm 05:27 PM
To work on file upload we are going to use the form helper. Here, is an example for file upload.
 Discuss CakePHP
Sep 10, 2024 pm 05:28 PM
CakePHP is an open-source framework for PHP. It is intended to make developing, deploying and maintaining applications much easier. CakePHP is based on a MVC-like architecture that is both powerful and easy to grasp. Models, Views, and Controllers gu
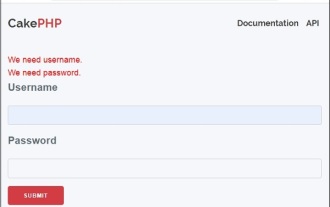 CakePHP Creating Validators
Sep 10, 2024 pm 05:26 PM
Validator can be created by adding the following two lines in the controller.
 CakePHP Logging
Sep 10, 2024 pm 05:26 PM
Logging in CakePHP is a very easy task. You just have to use one function. You can log errors, exceptions, user activities, action taken by users, for any background process like cronjob. Logging data in CakePHP is easy. The log() function is provide
 How To Set Up Visual Studio Code (VS Code) for PHP Development
Dec 20, 2024 am 11:31 AM
Visual Studio Code, also known as VS Code, is a free source code editor — or integrated development environment (IDE) — available for all major operating systems. With a large collection of extensions for many programming languages, VS Code can be c


