

How to use Eclipse PDT to debug PHP programs_PHP tutorial

This article mainly introduces how to use eclipse pdt to debug PHP code.
1. Download eclipse, just find it from the official website, and confirm that there is a java environment in the current system, that is, jdk and jre.
2. Pdt is installed, using online installation, and the update address is already included in the default. It's just more troublesome to update. (If you directly download the Eclipse version with PDT, you can omit it)
3. Download the debugger. There are two debuggers, one is xdebug and the other is zenddebug. This article uses xdebug.
What you downloaded should be the source code package. Unzip it, then cd to the directory, and then phpize. Sometimes this program may not be available, just run sudo apt-get install php5-dev and it will be fine. Then the familiar config program ./configure will appear. A series of black and white screen characters will appear, followed by make and make install. When the latter two commands are executed, sudo permissions may be required because they involve copying program files to the system directory.
4. Create an xdebug.ini file in /etc/php5/apache2/conf.d/. You can use vi or other text programs and add the following configuration items. The configuration content is as follows:
zend_extension="/usr/lib/php5/20090626+lfs/xdebug.so"
xdebug.remote_handler=dbgp
xdebug.remote_port=9000
xdebug.auto_trace=on
xdebug.collect_params=on
xdebug.collect_return=on
xdebug.max_nesring_level=100
xdebug.profile_enable=on
xdebug.remote_enable=on
xdebug.remote_host=localhost
xdebug.trace_output_dir="/tmp"
xdebug.profile_output_dir="/tmp"
xdebug.idekey=webide
xdebug.mode=req
ini files placed in this directory will be automatically loaded by php.
At this point, the installation and configuration of xdebug has been completed.
5. Open eclipse, then select window preference, first configure the service options:
First configure debug, select php, select debug, and select php's debugger as xDebug. Then configure the Server,
Select PHP Servers, then pop up the menu: Then click new, select a name at Name, and configure the url as the main debugging url.
Then set it to default.
Finally configure PHP Executables, add a name, set the path to /usr/bin/php and then set the location of ini at /etc/php5/apache2/php.ini
The SAPI Type should be set to CGI, but it seems that it cannot be adjusted. I don’t know why.
Finally, set the PHP debugger to XDebug.
6. Everything is ready, create a new php project, these must be found in your apache, then create a new php page, write a piece of code, add a few breakpoints, then right-click the php page and select debug as phpscript to see When you get to the familiar debugging window, you can see the variable list, post, get values, etc.

Hot AI Tools

Undresser.AI Undress
AI-powered app for creating realistic nude photos

AI Clothes Remover
Online AI tool for removing clothes from photos.

Undress AI Tool
Undress images for free

Clothoff.io
AI clothes remover

AI Hentai Generator
Generate AI Hentai for free.

Hot Article
Hot Tools

Notepad++7.3.1
Easy-to-use and free code editor

SublimeText3 Chinese version
Chinese version, very easy to use

Zend Studio 13.0.1
Powerful PHP integrated development environment

Dreamweaver CS6
Visual web development tools

SublimeText3 Mac version
God-level code editing software (SublimeText3)
Hot Topics


 How to make Google Maps the default map in iPhone
Apr 17, 2024 pm 07:34 PM
How to make Google Maps the default map in iPhone
Apr 17, 2024 pm 07:34 PM
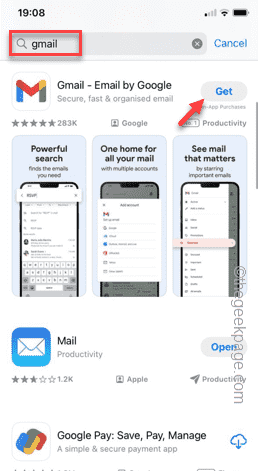
The default map on the iPhone is Maps, Apple's proprietary geolocation provider. Although the map is getting better, it doesn't work well outside the United States. It has nothing to offer compared to Google Maps. In this article, we discuss the feasible steps to use Google Maps to become the default map on your iPhone. How to Make Google Maps the Default Map in iPhone Setting Google Maps as the default map app on your phone is easier than you think. Follow the steps below – Prerequisite steps – You must have Gmail installed on your phone. Step 1 – Open the AppStore. Step 2 – Search for “Gmail”. Step 3 – Click next to Gmail app
 Fix: Operator denied request error in Windows Task Scheduler
Aug 01, 2023 pm 08:43 PM
Fix: Operator denied request error in Windows Task Scheduler
Aug 01, 2023 pm 08:43 PM
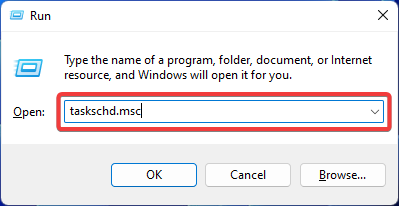
To automate tasks and manage multiple systems, mission planning software is a valuable tool in your arsenal, especially as a system administrator. Windows Task Scheduler does the job perfectly, but lately many people have reported operator rejected request errors. This problem exists in all iterations of the operating system, and even though it has been widely reported and covered, there is no effective solution. Keep reading to find out what might actually work for other people! What is the request in Task Scheduler 0x800710e0 that was denied by the operator or administrator? Task Scheduler allows automating various tasks and applications without user input. You can use it to schedule and organize specific applications, configure automatic notifications, help deliver messages, and more. it
 How to sort photos by face on Windows 10 and 11
Aug 08, 2023 pm 10:41 PM
How to sort photos by face on Windows 10 and 11
Aug 08, 2023 pm 10:41 PM
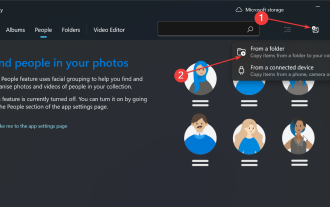
The operation of Windows is getting better and better with every version, with attractive features to improve the user experience. One feature users will want to explore on Windows 10 and 11 is the ability to sort photos by faces. This feature allows you to group photos of friends and family using facial recognition. Sounds fun, right? Read on to learn how to take advantage of this feature. Can I group photos by faces on Windows? Yes, you can use the Photos app to group pictures by faces on Windows 10 and 11. However, this feature is not available on the Photos app version. Additionally, you can link these photos to contacts using the People tab. Therefore, using this function you can
 How to Automatically Toggle iPhone Orientation Lock for Specific Apps
Jun 06, 2023 am 08:22 AM
How to Automatically Toggle iPhone Orientation Lock for Specific Apps
Jun 06, 2023 am 08:22 AM
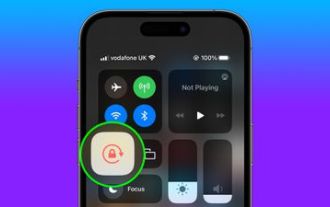
In iOS, many apps display different views when you rotate your iPhone from portrait to landscape. Depending on the app and how it's used, this behavior isn't always desirable, which is why Apple includes an orientation lock option in Control Center. However, some apps work more usefully with orientation lock disabled—think YouTube or the Photos app, where rotating the device to landscape provides a better full-screen viewing experience. If you prefer to stay locked down, you'll have to disable it in Control Center to get a full-screen experience every time you open these types of apps. Then when you close the app, you have to remember to turn orientation lock back on, which isn't ideal. Fortunately, you can create
 Clock app missing in iPhone: How to fix it
May 03, 2024 pm 09:19 PM
Clock app missing in iPhone: How to fix it
May 03, 2024 pm 09:19 PM
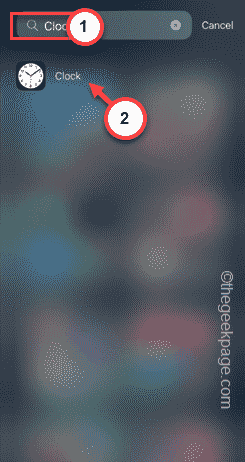
Is the clock app missing from your phone? The date and time will still appear on your iPhone's status bar. However, without the Clock app, you won’t be able to use world clock, stopwatch, alarm clock, and many other features. Therefore, fixing missing clock app should be at the top of your to-do list. These solutions can help you resolve this issue. Fix 1 – Place the Clock App If you mistakenly removed the Clock app from your home screen, you can put the Clock app back in its place. Step 1 – Unlock your iPhone and start swiping to the left until you reach the App Library page. Step 2 – Next, search for “clock” in the search box. Step 3 – When you see “Clock” below in the search results, press and hold it and
 How to write a simple countdown program in C++?
Nov 03, 2023 pm 01:39 PM
How to write a simple countdown program in C++?
Nov 03, 2023 pm 01:39 PM
C++ is a widely used programming language that is very convenient and practical in writing countdown programs. Countdown program is a common application that can provide us with very precise time calculation and countdown functions. This article will introduce how to use C++ to write a simple countdown program. The key to implementing a countdown program is to use a timer to calculate the passage of time. In C++, we can use the functions in the time.h header file to implement the timer function. The following is the code for a simple countdown program
 How to open a website using Task Scheduler
Oct 02, 2023 pm 11:13 PM
How to open a website using Task Scheduler
Oct 02, 2023 pm 11:13 PM
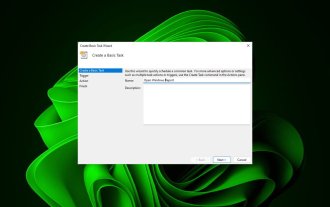
Do you frequently visit the same website at about the same time every day? This can lead to spending a lot of time with multiple browser tabs open and cluttering the browser while performing daily tasks. Well, how about opening it without having to launch the browser manually? It's very simple and doesn't require you to download any third-party apps, as shown below. How do I set up Task Scheduler to open a website? Press the key, type Task Scheduler in the search box, and then click Open. Windows On the right sidebar, click on the Create Basic Task option. In the Name field, enter the name of the website you want to open and click Next. Next, under Triggers, click Time Frequency and click Next. Select how long you want the event to repeat and click Next. Select enable
 iOS 17: How to organize iMessage apps in Messages
Sep 18, 2023 pm 05:25 PM
iOS 17: How to organize iMessage apps in Messages
Sep 18, 2023 pm 05:25 PM
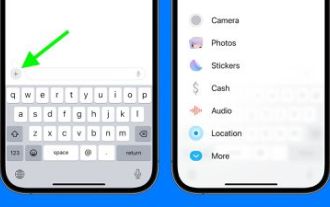
In iOS 17, Apple not only added several new messaging features, but also tweaked the design of the Messages app to give it a cleaner look. All iMessage apps and tools, such as the camera and photo options, can now be accessed by tapping the "+" button above the keyboard and to the left of the text input field. Clicking the "+" button brings up a menu column with a default order of options. Starting from the top, there's camera, photos, stickers, cash (if available), audio, and location. At the very bottom is a "More" button, which when tapped will reveal any other installed messaging apps (you can also swipe up to reveal this hidden list). How to reorganize your iMessage app You can do this below
