Monitor your SQL SERVER--Exposing bottlenecks_PHP Tutorial
When you suspect that computer hardware is the main reason affecting SQL Server performance, you can monitor the load of the corresponding hardware through SQL Server Performance Monitor to confirm your guess and identify system bottlenecks. The following will introduce some commonly used analysis objects and their parameters.
Memory: Page Faults / sec
If this value occasionally goes high, it indicates that there are threads competing for memory at that time. If it's consistently high, memory may be the bottleneck.
Process: Working Set
This parameter of SQL Server should be very close to the memory value allocated to SQL Server. In the SQL Server settings, if "set working set size" is set to 0, Windows NT will determine the size of the SQL Server working set. If "set working set size" is set to 1, the working set size is forced to be the allocated memory size of SQL Server. In general, it is best not to change the default value of "set working set size".
Process:%Processor Time
If the parameter value continues to exceed 95%, it indicates that the bottleneck is the CPU. Consider adding a processor or changing to a faster processor.
Processor:%Privileged Time
If this parameter value and the "Physical Disk" parameter value are always high, it indicates that there is an I/O problem. Consider replacing the hard drive system with a faster one. In addition, setting Tempdb in RAM, reducing "max async IO", "max lazy writer IO" and other measures will reduce this value.
Processor:%User Time
Indicates CPU-consuming database operations, such as sorting, executing aggregate functions, etc. If the value is very high, consider adding indexes, and try to use simple table joins, horizontal splitting of large tables, etc. to reduce the value.
Physical Disk:Avg.Disk Queue Length
This value should not exceed 1.5~2 times the number of disks. To improve performance, add disks.
Note: A Raid Disk actually has multiple disks.
SQLServer:Cache Hit Ratio
The higher the value, the better. If it continues to be below 80%, you should consider adding more memory.
Note that this parameter value has been accumulated since SQL Server started, so after running for a period of time, the value will not reflect the current value of the system.

Hot AI Tools

Undresser.AI Undress
AI-powered app for creating realistic nude photos

AI Clothes Remover
Online AI tool for removing clothes from photos.

Undress AI Tool
Undress images for free

Clothoff.io
AI clothes remover

AI Hentai Generator
Generate AI Hentai for free.

Hot Article

Hot Tools

Notepad++7.3.1
Easy-to-use and free code editor

SublimeText3 Chinese version
Chinese version, very easy to use

Zend Studio 13.0.1
Powerful PHP integrated development environment

Dreamweaver CS6
Visual web development tools

SublimeText3 Mac version
God-level code editing software (SublimeText3)

Hot Topics
 1386
1386
 52
52
 Remote Desktop cannot authenticate the remote computer's identity
Feb 29, 2024 pm 12:30 PM
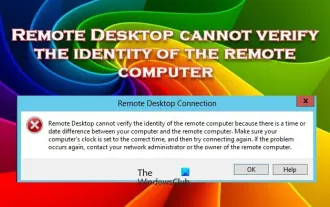
Windows Remote Desktop Service allows users to access computers remotely, which is very convenient for people who need to work remotely. However, problems can be encountered when users cannot connect to the remote computer or when Remote Desktop cannot authenticate the computer's identity. This may be caused by network connection issues or certificate verification failure. In this case, the user may need to check the network connection, ensure that the remote computer is online, and try to reconnect. Also, ensuring that the remote computer's authentication options are configured correctly is key to resolving the issue. Such problems with Windows Remote Desktop Services can usually be resolved by carefully checking and adjusting settings. Remote Desktop cannot verify the identity of the remote computer due to a time or date difference. Please make sure your calculations
 What is the difference between HQL and SQL in Hibernate framework?
Apr 17, 2024 pm 02:57 PM
HQL and SQL are compared in the Hibernate framework: HQL (1. Object-oriented syntax, 2. Database-independent queries, 3. Type safety), while SQL directly operates the database (1. Database-independent standards, 2. Complex executable queries and data manipulation).
 2024 CSRankings National Computer Science Rankings Released! CMU dominates the list, MIT falls out of the top 5
Mar 25, 2024 pm 06:01 PM
The 2024CSRankings National Computer Science Major Rankings have just been released! This year, in the ranking of the best CS universities in the United States, Carnegie Mellon University (CMU) ranks among the best in the country and in the field of CS, while the University of Illinois at Urbana-Champaign (UIUC) has been ranked second for six consecutive years. Georgia Tech ranked third. Then, Stanford University, University of California at San Diego, University of Michigan, and University of Washington tied for fourth place in the world. It is worth noting that MIT's ranking fell and fell out of the top five. CSRankings is a global university ranking project in the field of computer science initiated by Professor Emery Berger of the School of Computer and Information Sciences at the University of Massachusetts Amherst. The ranking is based on objective
 VBOX_E_OBJECT_NOT_FOUND(0x80bb0001)VirtualBox error
Mar 24, 2024 am 09:51 AM
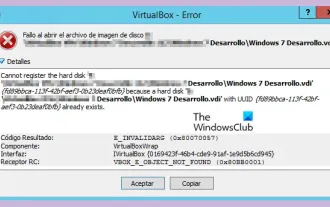
When trying to open a disk image in VirtualBox, you may encounter an error indicating that the hard drive cannot be registered. This usually happens when the VM disk image file you are trying to open has the same UUID as another virtual disk image file. In this case, VirtualBox displays error code VBOX_E_OBJECT_NOT_FOUND(0x80bb0001). If you encounter this error, don’t worry, there are some solutions you can try. First, you can try using VirtualBox's command line tools to change the UUID of the disk image file, which will avoid conflicts. You can run the command `VBoxManageinternal
 How to execute .sh file in Linux system?
Mar 14, 2024 pm 06:42 PM
How to execute .sh file in Linux system? In Linux systems, a .sh file is a file called a Shell script, which is used to execute a series of commands. Executing .sh files is a very common operation. This article will introduce how to execute .sh files in Linux systems and provide specific code examples. Method 1: Use an absolute path to execute a .sh file. To execute a .sh file in a Linux system, you can use an absolute path to specify the location of the file. The following are the specific steps: Open the terminal
 Usage of division operation in Oracle SQL
Mar 10, 2024 pm 03:06 PM
"Usage of Division Operation in OracleSQL" In OracleSQL, division operation is one of the common mathematical operations. During data query and processing, division operations can help us calculate the ratio between fields or derive the logical relationship between specific values. This article will introduce the usage of division operation in OracleSQL and provide specific code examples. 1. Two ways of division operations in OracleSQL In OracleSQL, division operations can be performed in two different ways.
 Comparison and differences of SQL syntax between Oracle and DB2
Mar 11, 2024 pm 12:09 PM
Oracle and DB2 are two commonly used relational database management systems, each of which has its own unique SQL syntax and characteristics. This article will compare and differ between the SQL syntax of Oracle and DB2, and provide specific code examples. Database connection In Oracle, use the following statement to connect to the database: CONNECTusername/password@database. In DB2, the statement to connect to the database is as follows: CONNECTTOdataba
 PyCharm usage tutorial: guide you in detail to run the operation
Feb 26, 2024 pm 05:51 PM
PyCharm is a very popular Python integrated development environment (IDE). It provides a wealth of functions and tools to make Python development more efficient and convenient. This article will introduce you to the basic operation methods of PyCharm and provide specific code examples to help readers quickly get started and become proficient in operating the tool. 1. Download and install PyCharm First, we need to go to the PyCharm official website (https://www.jetbrains.com/pyc


