 Backend Development
 PHP Tutorial
 Detailed explanation of the use of Xdebug PHP debugger_PHP tutorial
Detailed explanation of the use of Xdebug PHP debugger_PHP tutorial
Although you can use PHP to create command-line scripts for tasks like system administration and traditional data processing, the programming language has a major impact on the performance of your web application. During use, each PHP application resides on the server, and the PHP application will be called through a proxy (such as Apache) to handle incoming requests. For each request, a typical PHP web application will get a web page or XML data structure after a brief run.
Assuming that after a simple run, a web application constructed in layers - including client, network, HTTP server, application code and underlying database - will be difficult to isolate errors in the PHP code. Even assuming that all layers except the PHP code are functioning properly, tracking down bugs in the PHP code can be very difficult, especially if the application utilizes a large number of classes.
The PHP statement echo and the functions var_dump(), debug_zval_dump() and print_r() are common and popular debugging aids that can help solve a variety of problems. However, these statements - and even more robust tools such as the PEAR Log package - are forensic tools that must first be speculatively analyzed outside of context to generate evidence.
To a certain extent, debugging through inference is a foolhardy approach. Collect and sift through data to try to deduce what went wrong. If important information is missing, you must retest the code, repeat the steps, and start research again. A more efficient approach is to probe the application while it is running. You can sort request parameters, filter the procedure call stack, and query for any desired variables or objects. You can temporarily interrupt your application and receive alerts when variables change value. In some cases, you can actually influence variables by interactively asking "What if?" questions.
Special applications called debuggers support this “live” or interactive inspection. A debugger may be started and attached to the process in order to control the process and monitor its memory. Alternatively, in the case of an interpreted language, the debugger can interpret the code directly. A typical modern graphical debugger can index and browse code, easily display complex data structures in a human-readable form, and simultaneously display program state such as the call stack, intermediate output, and the values of all variables. For example, debuggers typically categorize and describe class properties and methods.
In this and the next article, I will introduce tools that are sure to simplify PHP debugging. Next time, I'll focus on interactive debugging and the Zend Debugger - a robust debugger specifically for PHP - and explore the many features it offers. (Zend Debugger is a commercial product and is part of the Zend PHP integrated development environment (IDE)). I'll also introduce an open source PHP debugger, lest you spend your money on beer instead of code. However, this article will focus on how to better collect evidence.
Similar to CSI, only more annoying
When your code goes wrong, fails to produce a desired result, or crashes completely, you need to answer the four w questions: where, what, why, and when:
“where” is the file and line number where the application last ran normally.
“What” is code for a mistake – for example, a suspect.
“Why” is the essence of the error. Maybe it's a logic error and/or an error caused by interaction with the operating system, or both.
And “when” is the context when an error occurs. What happened before the program was terminated? As in all crimes, if you can gather enough clues, the clues can help you find the culprit.
A forensic tool Xdebug (the tool used in the previous article to analyze PHP application performance), as the name suggests, will provide several functions that illustrate the status of the program, and should be added to the command system A valuable research tool (see Resources). Once installed, Xdebug will prevent infinite recursion (ostensibly), fix error messages about stack traces and function traces, and monitor memory allocations, among other features. Xdebug also includes a set of functions that you can add to your code for runtime error diagnosis.
For example, the following code will test the callee() function using some xdebug_...() steps to output the exact location of the calling program, including the file name, line number, and name of the calling function.
Listing 1. Steps to test the callee() function
Function callee( $a ) {
echo sprintf("callee() called @ %s: %s from %s",
xdebug_call_file(),
xdebug_call_line(),
xdebug_call_function()
);
}
$result = callee( "arg" );
?>
This code will generate:
callee() called @ /var/www/catalog/xd.php: 10 from {main}
Back to top Building and installing Xdebug
Xdebug can be easily built from source code in UNIX®-like operating systems, including Mac OS X. If you are using PHP on Microsoft® Windows®, you can download the latest PHP version of the binary Xdebug module from the Xdebug Web site (see Resources).
Let’s build and install Xdebug for Debian “Sarge” Linux® and PHP V4.3.10-19. As of this writing, the latest version of Xdebug is V2.0.0RC4, released on May 17, 2007. To continue with this article, you must have the phpize and php-config utilities, and you must be able to edit your system's php.ini configuration file (if you don't have the utilities, visit PHP.net for source code and instructions on how to build PHP from scratch). Please follow these steps:
Download the Xdebug tarball (a gzip-compressed .tar archive). The wget command can help you do this easily: $ wget http://www.xdebug.org/files/xdebug-2.0.0RC4.tgz
Extract the tarball and switch to the source code directory: $ tar xzf xdebug-2.0.0RC4.tgz
$ cd xdebug-2.0.0RC4
Run phpize to prepare Xdebug code for your version of PHP: $ phpize
Configuring for:
PHP Api Version: 20020918
Zend Module Api No: 20020429
Zend Extension Api No: 20021010
The output of phpize is a script - usually named configure - that is used to tweak the rest of the build process.
Run the configuration script: $ ./configure
Checking build system type... i686-pc-linux-gnu
Checking host system type... i686-pc-linux-gnu
checking for gcc... gcc
checking for C compiler default output file name... a.out
Checking whether the C compiler works... yes
checking whether we are cross compiling... no
Checking for suffix of executables...
checking for suffix of object files... o
…
checking whether stripping libraries is possible... yes
Appending configuration tag "F77" to libtool
configure: creating ./config.status
config.status: creating config.h
Build the Xdebug extension by running make: $ make
/bin/sh /home/strike/tmp/xdebug-2.0.0RC4/libtool
--mode=compile gcc -I.
-I/home/strike/tmp/xdebug-2.0.0RC4 -DPHP_ATOM_INC
-I/home/strike/tmp/xdebug-2.0.0RC4/include
-I/home/strike/tmp/xdebug-2.0.0RC4/main
-I/home/strike/tmp/xdebug-2.0.0RC4
-I/usr/include/php4 -I/usr/include/php4/main
-I/usr/include/php4/Zend -I/usr/include/php4/TSRM
-DHAVE_CONFIG_H -g -O0 -c
/home/strike/tmp/xdebug-2.0.0RC4/xdebug.c -o
xdebug.lo mkdir .libs
…
Build complete.
(It is safe to ignore warnings about tempnam and tmpnam).
Using make will generate the Xdebug extension xdebug.so.
Install the extension: $ sudo make install
Installing shared extensions: /usr/lib/php4/20020429/
Before continuing, use the mouse to select and copy the directory shown by the previous command. This path is critical for the final step of configuring the extension.
Open the php.ini file in your favorite text editor and add the following code: zend_extension = /usr/lib/php4/20020429/xdebug.so
xdebug.profiler_enable = Off
xdebug.default_enable = On
The first line will load the Xdebug extension; the second line will disable Xdebug's profiler functionality (just for simplicity), and the third line will enable the extended debugging functionality.
To verify that the Xdebug extension is installed and enabled, restart the web server and create a simple one-line PHP application with the code . If you point your browser to the file -- such as http://localhost/phpinfo.php -- and scroll down, you should see something similar to Figure 1.
Figure 1. Verify whether the Xdebug extension is installed and running

NOTE: If you don’t see the Xdebug section in the output of phpinfo(), Xdebug failed to load. The Apache error log lists the reason. Common errors include the wrong path to zend_extension or conflicts with other extensions. For example, if you need to use XCache and Xdebug, be sure to load XCache first. However, since Xdebug is intended for use during development and assumes the path to xdebug.so is correct, you will need to disable the other extensions and try again. You can then re-enable the extension to perform additional tests, such as the effects of caching. The Xdebug site has some other troubleshooting tips.

Hot AI Tools

Undresser.AI Undress
AI-powered app for creating realistic nude photos

AI Clothes Remover
Online AI tool for removing clothes from photos.

Undress AI Tool
Undress images for free

Clothoff.io
AI clothes remover

AI Hentai Generator
Generate AI Hentai for free.

Hot Article

Hot Tools

Notepad++7.3.1
Easy-to-use and free code editor

SublimeText3 Chinese version
Chinese version, very easy to use

Zend Studio 13.0.1
Powerful PHP integrated development environment

Dreamweaver CS6
Visual web development tools

SublimeText3 Mac version
God-level code editing software (SublimeText3)

Hot Topics
 CakePHP Project Configuration
Sep 10, 2024 pm 05:25 PM
In this chapter, we will understand the Environment Variables, General Configuration, Database Configuration and Email Configuration in CakePHP.
 PHP 8.4 Installation and Upgrade guide for Ubuntu and Debian
Dec 24, 2024 pm 04:42 PM
PHP 8.4 brings several new features, security improvements, and performance improvements with healthy amounts of feature deprecations and removals. This guide explains how to install PHP 8.4 or upgrade to PHP 8.4 on Ubuntu, Debian, or their derivati
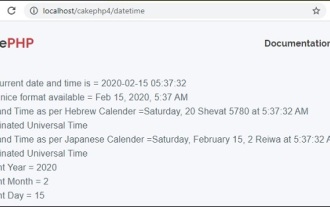 CakePHP Date and Time
Sep 10, 2024 pm 05:27 PM
To work with date and time in cakephp4, we are going to make use of the available FrozenTime class.
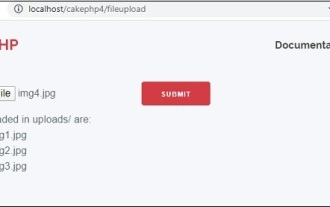 CakePHP File upload
Sep 10, 2024 pm 05:27 PM
To work on file upload we are going to use the form helper. Here, is an example for file upload.
 CakePHP Routing
Sep 10, 2024 pm 05:25 PM
In this chapter, we are going to learn the following topics related to routing ?
 Discuss CakePHP
Sep 10, 2024 pm 05:28 PM
CakePHP is an open-source framework for PHP. It is intended to make developing, deploying and maintaining applications much easier. CakePHP is based on a MVC-like architecture that is both powerful and easy to grasp. Models, Views, and Controllers gu
 CakePHP Creating Validators
Sep 10, 2024 pm 05:26 PM
Validator can be created by adding the following two lines in the controller.
 CakePHP Working with Database
Sep 10, 2024 pm 05:25 PM
Working with database in CakePHP is very easy. We will understand the CRUD (Create, Read, Update, Delete) operations in this chapter.


