
 Backend Development
PHP Tutorial
Implementation code for php to generate pie chart effect_PHP tutorial
Backend Development
PHP Tutorial
Implementation code for php to generate pie chart effect_PHP tutorial
Implementation code for php to generate pie chart effect_PHP tutorial

Many codes can be used to generate pie charts. The example we introduce today is a pie chart effect that generates statistical data based on the PHP gd library. Students in need can refer to it.
| The code is as follows | Copy code |
| //+--------- ----------------+ //| pie3dfun.PHP//Public functions| //+--------------- ---------+ define("ANGLE_STEP", 5); //Define the angle step when drawing an elliptical arc function draw_getdarkcolor($img,$clr) //Find $clr Corresponding dark color { $rgb = imagecolorsforindex($img,$clr); return array($rgb["red"]/2,$rgb["green"]/2,$rgb ["blue"]/2); } function draw_getexy($a, $b, $d) //Find the point coordinates on the ellipse corresponding to angle $d { $d = deg2rad($d); return array(round($a*Cos($d)), round($b*Sin($d))); } function draw_arc($img ,$ox,$oy,$a,$b,$sd,$ed,$clr) //Elliptic arc function { $n = ceil(($ed-$sd)/ANGLE_STEP); $d = $sd; list($x0,$y0) = draw_getexy($a,$b,$d); for($i=0; $i<$n; $ i++) { $d = ($d+ANGLE_STEP)>$ed?$ed:($d+ANGLE_STEP); list($x, $y) = draw_getexy($a, $b, $d); imageline($img, $x0+$ox, $y0+$oy, $x+$ox, $y+$oy, $clr); $x0 = $x; $y0 = $y; } } function draw_sector($img, $ox, $oy, $a, $b, $sd, $ed, $clr) //Draw a sector { $n = ceil(($ed-$sd)/ANGLE_STEP); $d = $sd; list($x0,$y0) = draw_getexy($a, $b , $d); imageline($img, $x0+$ox, $y0+$oy, $ox, $oy, $clr); for($i=0; $i<$n; $ i++) { $d = ($d+ANGLE_STEP)>$ed?$ed:($d+ANGLE_STEP); list($x, $y) = draw_getexy($a, $b, $d); imageline($img, $x0+$ox, $y0+$oy, $x+$ox, $y+$oy, $clr); $x0 = $x; $y0 = $y; } imageline($img, $x0+$ox, $y0+$oy, $ox, $oy, $clr); list($x, $y) = draw_getexy($a/2, $b/2, ($d+$sd)/2); imagefill($img, $x+$ox, $y+$oy, $clr); } function draw_sector3d($img, $ox, $oy, $a, $b, $v, $sd, $ed, $clr) //3d sector { draw_sector($img, $ox , $oy, $a, $b, $sd, $ed, $clr); if($sd<180) { list($R, $G, $B) = draw_getdarkcolor ($img, $clr); $clr=imagecolorallocate($img, $R, $G, $B); if($ed>180) $ed = 180; list($ sx, $sy) = draw_getexy($a,$b,$sd); $sx += $ox; $sy += $oy; list($ex, $ey) = draw_getexy($a, $b, $ed); $ex += $ox; $ey += $oy; imageline($img, $sx, $sy, $sx, $ sy+$v, $clr); imageline($img, $ex, $ey, $ex, $ey+$v, $clr); draw_arc($img, $ox, $oy+$v, $a, $b, $sd, $ed, $clr); list($sx, $sy) = draw_getexy($a, $b, ($sd+$ed)/2); $ sy += $oy+$v/2; $sx += $ox; imagefill($img, $sx, $sy, $clr); } } function draw_getindexcolor($img, $clr) //RBG to index color { $R = ($clr>>16) & 0xff; $G = ($clr>>8)& 0xff; $B = ($clr) & 0xff; return imagecolorallocate($img, $R, $G, $B); } // Drawing main function and output image // $datLst is the data array, $datLst is the label array, $datLst is the color array // The dimensions of the above three arrays should be equal function draw_img($datLst,$labLst,$clrLst ,$a=250,$b=120,$v=20,$font=10) { $ox = 5+$a; $oy = 5+$b; $fw = imagefontwidth($font); $fh = imagefontheight($font); $n = count($datLst);//Number of data items $w = 10+$a* 2; $h = 10+$b*2+$v+($fh+2)*$n; $img = imagecreate($w, $h); //Convert RGB to Index color for($i=0; $i<$n; $i++) $clrLst[$i] = draw_getindexcolor($img,$clrLst[$i]); $clrbk = imagecolorallocate($img, 0xff, 0xff, 0xff); $clrt = imagecolorallocate($img, 0x00, 0x00, 0x00); //Fill the background color imagefill($img, 0, 0, $clrbk); //Sum $tot = 0; for($i=0; $i<$n; $i++) $tot += $datLst[$i ]; $sd = 0; $ed = 0; 333 $ly = 10+$b*2+$v; for($i=0; $i<$n ; $i++) { $sd = $ed; $ed += $datLst[$i]/$tot*360; //Draw a round cake draw_sector3d($ img, $ox, $oy, $a, $b, $v, $sd, $ed, $clrLst[$i]); //$sd,$ed,$clrLst[$i]); //Draw label imagefilledrectangle($img, 5, $ly, 5+$fw, $ly+$fh, $clrLst[$i]); imagerectangle($img, 5, $ly, 5+ $fw, $ly+$fh, $clrt); //imagestring($img, $font, 5+2*$fw, $ly, $labLst[$i].":".$datLst[$ i]."(".(round(10000*($datLst[$i]/$tot))/100)."%)", $clrt); $str = iconv("GB2312", " UTF-8", $labLst[$i]); ImageTTFText($img, $font, 0, 5+2*$fw, $ly+13, $clrt, "./simsun.ttf", $str.":".$datLst[$i]."(" .(round(10000*($datLst[$i]/$tot))/100)."%)"); $ly += $fh+2; } //Output Graphics header("Content-type: image/png"); //Output the generated image $imgFileName = "../temp/".time().".png"; imagepng($img,$imgFileName); echo ''''''''''''''''''''''''''''''' '''''''''''''''''''''''''''''''''' } $datLst = array(30, 10, 20, 20, 10, 20, 10, 20); //data $labLst = array("University of Science and Technology of China", "Anhui University of Science and Technology", "Tsinghua University", "Peking University", "Nanjing University", "Shanghai University", "Hohai University", "Sun Yat-sen University"); //Tag $clrLst = array(0x99ff00, 0xff6666, 0x0099ff, 0xff99ff, 0xffff99, 0x99ffff, 0xff3333, 0x009999); //Draw draw_img($datLst,$labLst,$clrLst); ?> | |
The rendering is as follows

Hot AI Tools

Undresser.AI Undress
AI-powered app for creating realistic nude photos

AI Clothes Remover
Online AI tool for removing clothes from photos.

Undress AI Tool
Undress images for free

Clothoff.io
AI clothes remover

AI Hentai Generator
Generate AI Hentai for free.

Hot Article
Hot Tools

Notepad++7.3.1
Easy-to-use and free code editor

SublimeText3 Chinese version
Chinese version, very easy to use

Zend Studio 13.0.1
Powerful PHP integrated development environment

Dreamweaver CS6
Visual web development tools

SublimeText3 Mac version
God-level code editing software (SublimeText3)
Hot Topics


 CakePHP Project Configuration
Sep 10, 2024 pm 05:25 PM
CakePHP Project Configuration
Sep 10, 2024 pm 05:25 PM
In this chapter, we will understand the Environment Variables, General Configuration, Database Configuration and Email Configuration in CakePHP.
 PHP 8.4 Installation and Upgrade guide for Ubuntu and Debian
Dec 24, 2024 pm 04:42 PM
PHP 8.4 Installation and Upgrade guide for Ubuntu and Debian
Dec 24, 2024 pm 04:42 PM
PHP 8.4 brings several new features, security improvements, and performance improvements with healthy amounts of feature deprecations and removals. This guide explains how to install PHP 8.4 or upgrade to PHP 8.4 on Ubuntu, Debian, or their derivati
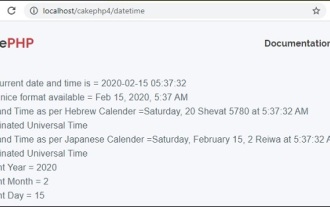 CakePHP Date and Time
Sep 10, 2024 pm 05:27 PM
CakePHP Date and Time
Sep 10, 2024 pm 05:27 PM
To work with date and time in cakephp4, we are going to make use of the available FrozenTime class.
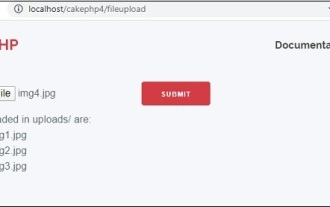 CakePHP File upload
Sep 10, 2024 pm 05:27 PM
CakePHP File upload
Sep 10, 2024 pm 05:27 PM
To work on file upload we are going to use the form helper. Here, is an example for file upload.
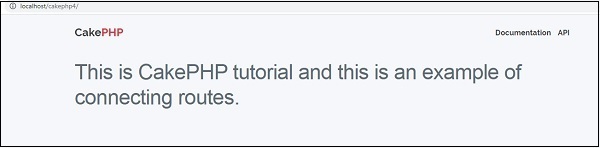 CakePHP Routing
Sep 10, 2024 pm 05:25 PM
CakePHP Routing
Sep 10, 2024 pm 05:25 PM
In this chapter, we are going to learn the following topics related to routing ?
 Discuss CakePHP
Sep 10, 2024 pm 05:28 PM
Discuss CakePHP
Sep 10, 2024 pm 05:28 PM
CakePHP is an open-source framework for PHP. It is intended to make developing, deploying and maintaining applications much easier. CakePHP is based on a MVC-like architecture that is both powerful and easy to grasp. Models, Views, and Controllers gu
 How To Set Up Visual Studio Code (VS Code) for PHP Development
Dec 20, 2024 am 11:31 AM
How To Set Up Visual Studio Code (VS Code) for PHP Development
Dec 20, 2024 am 11:31 AM
Visual Studio Code, also known as VS Code, is a free source code editor — or integrated development environment (IDE) — available for all major operating systems. With a large collection of extensions for many programming languages, VS Code can be c
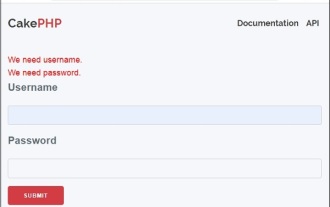 CakePHP Creating Validators
Sep 10, 2024 pm 05:26 PM
CakePHP Creating Validators
Sep 10, 2024 pm 05:26 PM
Validator can be created by adding the following two lines in the controller.
