
 Backend Development
PHP Tutorial
Discussion: How to analyze the internal status of Memcached through the stats command_PHP tutorial
Backend Development
PHP Tutorial
Discussion: How to analyze the internal status of Memcached through the stats command_PHP tutorial
Discussion: How to analyze the internal status of Memcached through the stats command_PHP tutorial

Memcached has a stats command, through which you can view many status information of the Memcached service. The usage is as follows:
First enter the telnet host name and port number directly on the command line to connect to the memcached server, and then after the connection is successful, enter the stats command to display the status information of the current memcached service.
For example, the test on my local machine is as follows:
stats
STAT pid 1552
STAT uptime 3792
STAT time 1262517674
STAT version 1.2.6
STAT pointer_size 32
STAT curr_items 1
STAT total_items 2
STAT bytes 593
STAT curr_connections 2
STAT total_connections 28
STAT connection_structures 9
STAT cmd_get 3
STAT cmd_set 2
STAT get_hits 2
STAT get_misses 1
STAT evictions 0
STAT bytes_read 1284
STAT bytes_written 5362
STAT limit_maxbytes 67108864
STAT threads 1
END
A lot of status information is displayed here. Each status item is explained in detail below:
1. pid: memcached service process Process ID
2. uptime: The time elapsed from the start of the memcached service to the current time, the unit is seconds.
3. Time: The current system time of the host where the memcached server is located, in seconds.
4. version: The version of the memcached component. Here's the 1.2.6 I'm currently using.
5. Pointer_size: The pointer size of the host operating system where the server is located, usually 32 or 64.
6. curr_items: Indicates the number of all cache objects stored in the current cache. Excludes objects that have currently been removed from the cache.
7. total_items: Indicates the number of all objects stored in the system from the start of the memcached service to the current time, including objects that have been deleted from the cache.
8. bytes: Indicates the storage space used by the system to store cache objects, in bytes.
9. curr_connections: Indicates the number of connections currently opened by the system.
10. total_connections: Indicates the total number of connections opened by the system from the start of the memcached service to the current time.
11. connection_structures: Indicates the number of connection structures allocated by the server from the start of the memcached service to the current time. This explanation is given by the protocol document. I haven’t figured out what it means yet.
12. cmd_get: The cumulative number of data obtained, here is 3, because I tested it 3 times. The first time, the data acquisition failed because there was no serialized object, and it was null. The next two times, I used different objects. Tested 2 times.
13. cmd_set: The cumulative number of saved data settings, here is 2. Although I stored it 3 times, the first time was not saved to the cache because it was not serialized, and there was no record.
14. get_hits: Indicates the number of successful data acquisitions.
15. get_misses: Indicates the number of failures to obtain data.
16. evictions: The number of cache objects removed from the cache in order to free up space for new data items. For example, objects that are removed according to the LRU algorithm when the cache size is exceeded, and expired objects.
17. bytes_read: The total number of bytes read by the memcached server from the network.
18. bytes_written: The total number of bytes sent by the memcached server to the network.
19. limit_maxbytes: The maximum number of bytes allowed to be used by the memcached service cache. Here it is 67108864 bytes, which is 64M. It is consistent with the size we set when starting the memcached service.
20. threads: The total number of requested worker threads. This explanation is given in the protocol document. I haven’t figured out what it means yet.
Summary: The stats command is generally very useful. Through this command, we know all aspects of the current memcached service information.

Hot AI Tools

Undresser.AI Undress
AI-powered app for creating realistic nude photos

AI Clothes Remover
Online AI tool for removing clothes from photos.

Undress AI Tool
Undress images for free

Clothoff.io
AI clothes remover

Video Face Swap
Swap faces in any video effortlessly with our completely free AI face swap tool!

Hot Article
Hot Tools

Notepad++7.3.1
Easy-to-use and free code editor

SublimeText3 Chinese version
Chinese version, very easy to use

Zend Studio 13.0.1
Powerful PHP integrated development environment

Dreamweaver CS6
Visual web development tools

SublimeText3 Mac version
God-level code editing software (SublimeText3)
Hot Topics
 1387
1387
 52
52

 How to run SUDO commands in Windows 11/10
Mar 09, 2024 am 09:50 AM
How to run SUDO commands in Windows 11/10
Mar 09, 2024 am 09:50 AM
The sudo command allows users to run commands in elevated privilege mode without switching to superuser mode. This article will introduce how to simulate functions similar to sudo commands in Windows systems. What is the Shudao Command? Sudo (short for "superuser do") is a command-line tool that allows users of Unix-based operating systems such as Linux and MacOS to execute commands with elevated privileges typically held by administrators. Running SUDO commands in Windows 11/10 However, with the launch of the latest Windows 11 Insider preview version, Windows users can now experience this feature. This new feature enables users to
 How to check the MAC address of the network card in Win11? How to use the command to obtain the MAC address of the network card in Win11
Feb 29, 2024 pm 04:34 PM
How to check the MAC address of the network card in Win11? How to use the command to obtain the MAC address of the network card in Win11
Feb 29, 2024 pm 04:34 PM
This article will introduce readers to how to use the command prompt (CommandPrompt) to find the physical address (MAC address) of the network adapter in Win11 system. A MAC address is a unique identifier for a network interface card (NIC), which plays an important role in network communications. Through the command prompt, users can easily obtain the MAC address information of all network adapters on the current computer, which is very helpful for network troubleshooting, configuring network settings and other tasks. Method 1: Use "Command Prompt" 1. Press the [Win+X] key combination, or [right-click] click the [Windows logo] on the taskbar, and in the menu item that opens, select [Run]; 2. Run the window , enter the [cmd] command, and then
 Where is hyperv enhanced session mode? Tips for enabling or disabling Hyper-V enhanced session mode using commands in Win11
Feb 29, 2024 pm 05:52 PM
Where is hyperv enhanced session mode? Tips for enabling or disabling Hyper-V enhanced session mode using commands in Win11
Feb 29, 2024 pm 05:52 PM
In Win11 system, you can enable or disable Hyper-V enhanced session mode through commands. This article will introduce how to use commands to operate and help users better manage and control Hyper-V functions in the system. Hyper-V is a virtualization technology provided by Microsoft. It is built into Windows Server and Windows 10 and 11 (except Home Edition), allowing users to run virtual operating systems in Windows systems. Although virtual machines are isolated from the host operating system, they can still use the host's resources, such as sound cards and storage devices, through settings. One of the key settings is to enable Enhanced Session Mode. Enhanced session mode is Hyper
 Super practical! Sar commands that will make you a Linux master
Mar 01, 2024 am 08:01 AM
Super practical! Sar commands that will make you a Linux master
Mar 01, 2024 am 08:01 AM
1. Overview The sar command displays system usage reports through data collected from system activities. These reports are made up of different sections, each containing the type of data and when the data was collected. The default mode of the sar command displays the CPU usage at different time increments for various resources accessing the CPU (such as users, systems, I/O schedulers, etc.). Additionally, it displays the percentage of idle CPU for a given time period. The average value for each data point is listed at the bottom of the report. sar reports collected data every 10 minutes by default, but you can use various options to filter and adjust these reports. Similar to the uptime command, the sar command can also help you monitor the CPU load. Through sar, you can understand the occurrence of excessive load
 How to set Momo status
Mar 01, 2024 pm 12:10 PM
How to set Momo status
Mar 01, 2024 pm 12:10 PM
Momo, a well-known social platform, provides users with a wealth of functional services for their daily social interactions. On Momo, users can easily share their life status, make friends, chat, etc. Among them, the setting status function allows users to show their current mood and status to others, thereby attracting more people's attention and communication. So how to set your own Momo status? The following will give you a detailed introduction! How to set status on Momo? 1. Open Momo, click More in the lower right corner, find and click Daily Status. 2. Select the status. 3. The setting status will be displayed.
 How to delete win11 widgets? One command to uninstall Windows 11 widgets function tips
Apr 11, 2024 pm 05:19 PM
How to delete win11 widgets? One command to uninstall Windows 11 widgets function tips
Apr 11, 2024 pm 05:19 PM
Widgets are a new feature of the Win11 system. They are turned on by default. However, it is inevitable that some users do not use widgets very much and want to disable them because they take up space. So how should they do this? The editor below will teach you how to operate it, and you can try it out. What are widgets? Widgets are small cards that display dynamic content from your favorite apps and services on your Windows desktop. They appear on the widget board, where you can discover, pin, unpin, arrange, resize, and customize widgets to reflect your interests. The widget board is optimized to display relevant widgets and personalized content based on usage. Open the widget panel from the left corner of the taskbar, where you can see live weather
 What is the correct way to restart a service in Linux?
Mar 15, 2024 am 09:09 AM
What is the correct way to restart a service in Linux?
Mar 15, 2024 am 09:09 AM
What is the correct way to restart a service in Linux? When using a Linux system, we often encounter situations where we need to restart a certain service, but sometimes we may encounter some problems when restarting the service, such as the service not actually stopping or starting. Therefore, it is very important to master the correct way to restart services. In Linux, you can usually use the systemctl command to manage system services. The systemctl command is part of the systemd system manager
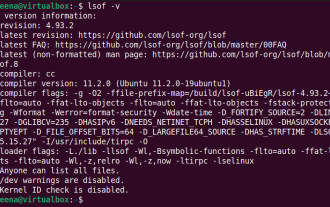 How to use LSOF to monitor ports in real time
Mar 20, 2024 pm 02:07 PM
How to use LSOF to monitor ports in real time
Mar 20, 2024 pm 02:07 PM
LSOF (ListOpenFiles) is a command line tool mainly used to monitor system resources similar to Linux/Unix operating systems. Through the LSOF command, users can get detailed information about the active files in the system and the processes that are accessing these files. LSOF can help users identify the processes currently occupying file resources, thereby better managing system resources and troubleshooting possible problems. LSOF is powerful and flexible, and can help system administrators quickly locate file-related problems, such as file leaks, unclosed file descriptors, etc. Via LSOF Command The LSOF command line tool allows system administrators and developers to: Determine which processes are currently using a specific file or port, in the event of a port conflict
