How to analyze Linux logs
|
There is a lot of information in the logs that you need to process, although sometimes it is not as easy as you think to extract it. In this article we’ll look at some basic log analysis examples you can do today (just search). We’ll also cover some more advanced analytics, but these require some effort on your part to set up properly and can save you a lot of time later. Examples of advanced analysis of data include generating summary counts, filtering on valid values, and more.
We'll first show you how to use several different tools from the command line, and then show how a log management tool can automate much of the heavy lifting and make log analysis simple.
Searching text with Grep
is the most basic way to find information. The most commonly used tool for searching text is grep. This command line tool, available on most Linux distributions, allows you to search logs using regular expressions. A regular expression is a pattern written in a special language that identifies matching text. The simplest pattern is to enclose the string you want to find in quotes.
Regular Expression
This is a lookup in the authentication log of the Ubuntu system " user hoover” Example:
$ grep "userhoover" /var/log/auth.log
Accepted password for hoover from 10.0.2.2 port 4792 ssh2
pam_unix( sshd:session): session opened for user hoover by (uid=0)
pam_unix(sshd:session): session closed for user hoover
Constructing an exact regular expression can be difficult. For example, if we wanted to search for a number like port "4792" , it might also match the timestamp, URL and Other unnecessary data. The example below in Ubuntu matches an Apache log that we don’t want.
$ grep "4792"/var/log/auth.log
Accepted password for hoover from 10.0.2.2 port 4792 ssh2
74.91.21.46 - -[31/Mar/2015:1 9: 44:32 +0000] "GET /scripts/samples/search?q=4972HTTP/1.0" 404 545 "-" "-"
surround search
Another useful tip is that you can do a surround search with grep . This will show you what is a few lines before or after a match. It can help you debug what is causing the error or problem. The B option displays the first few lines, and the A option displays the next few lines. For example, we know that when a person fails to log in as an administrator, their IP is not reverse-resolved, which means they may not have a valid domain name. This is very suspicious!
$ grep -B 3 -A 2'Invalid user' /var/log/auth.log
Apr 28 17:06:20ip-172-31-11-241 sshd[12545]: reverse mapping checking getaddrinfo for216-19-2-8.commspeed.net [216.19.2.8] failed - POSSIBLE BREAK-IN ATTEMPT!
Apr 28 17:06:20ip-172-31-11-241 sshd[12545] : Received disconnect from 216.19.2.8: 11: Bye Bye[preauth]
Apr 28 17:06:20ip-172-31-11-241 sshd[12547]: Invalid user admin from 216.19.2.8
Apr 28 17:06:20ip-172-31-11-241 sshd[12547]: input_userauth_request: invalid user admin[preauth]
Apr 28 17:06:20ip-172-31-11-241 sshd[12547 ]: Received disconnect from 216.19.2.8: 11: Bye Bye[preauth]
Tail
You can also put grep and tail Use in combination to get a The last few lines of the file, or trace the log and print it in real time. This is useful when you make interactive changes, such as starting a server or testing code changes.
$ tail -f/var/log/auth.log | grep 'Invalid user'
Apr 30 19:49:48ip-172-31-11-241 sshd[6512]: Invalid user ubnt from 219.140.64.136
Apr 30 19:49:49ip-172-31-11-241 sshd[6514]: Invalid user admin from 219.140.64.136
About grep and regular A detailed introduction to expressions is beyond the scope of this guide, but Ryan's Tutorials has a more in-depth introduction.
The log management system has higher performance and more powerful search capabilities. They often index data and run queries in parallel, so you can quickly search GB or TB of logs in seconds. In comparison, grep takes minutes, or even hours in extreme cases. Log management systems also use query languages like Lucene , which provides a simpler syntax for retrieving numbers, fields, and more.
Use Cut, AWK, and Grok Parsing
Command line tool
Linux provides multiple command line tools for text parsing and analysis. Very useful when you want to parse small amounts of data quickly, but may take a long time when processing large amounts of data.
Cut
cut The command allows you to parse fields from delimited logs. Delimiters refer to equal signs or commas that can separate fields or key-value pairs.
Suppose we want to parse out the user from the following log:
pam_unix(su:auth):authentication failure; logname=hoover uid=1000 euid=0 tty=/dev/pts/0ruser =hoover rhost= user=root
We can use the cut command as follows to get the text of the eighth field separated by an equal sign. Here's an example on an Ubuntu system:
$ grep "authentication failure" /var/log/auth.log | cut -d '=' -f 8
root
hoover
root
nagios
nagios
AWK
Also, you can also use awk, which provides more powerful parsing Field functions. It provides a scripting language that lets you filter out almost anything irrelevant.
For example, suppose we have the following line of logs in the Ubuntu system, and we want to extract the name of the user who failed to log in:
Mar 24 08:28:18ip-172 -31-11-241 sshd[32701]: input_userauth_request: invalid user guest[preauth]
You can use the awk command like below. First, use a regular expression /sshd.*invalid user/ to match the sshd invalid user line. Then use { print $9 } to print the ninth field based on the default delimiter space. This will output the username.
$ awk'/sshd.*invalid user/ { print $9 }' /var/log/auth.log
guest
admin
info
test ubnt
You can read more about how to use regular expressions and output fields in the Awk User Guide .
Log management system
The log management system makes analysis easier, allowing users to quickly analyze many log files. They can automatically parse standard log formats, such as common Linux logs and Web server logs. This saves a lot of time because you don't need to think about writing parsing logic yourself when dealing with system problems.
Below is an example of a sshd log message parsed out for each remoteHost and user. This is a screenshot from Loggly , a cloud-based log management service.
You can also customize the parsing of non-standard formats. A commonly used tool is Grok, which uses a common regular expression library and can parse raw text into structured JSON. The following is an example configuration of Grok parsing kernel log files in Logstash :
filter{
grok {
match => {" message" =>"%{CISCOTIMESTAMP:timestamp} %{HOST:host} %{WORD:program}%{NOTSPACE}%{NOTSPACE}%{NUMBER:duration}%{NOTSPACE} %{GREEDYDATA:kernel_logs}"
}
}
Use Rsyslog and AWK Filter
Filtering allows you to retrieve a specific field value instead of Full Text Search. This makes your log analysis more accurate because it ignores unwanted matches from other parts of the log information. In order to search for a field value, you first need to parse the log or at least have a way to retrieve the event structure.
How to filter apps
Usually, you may only want to see the logs of one app. This is easy if your application saves all records to a file. It's more complicated if you need to filter an application in an aggregated or centralized log. There are several ways to do this:
Use the rsyslog daemon to parse and filter logs. The following example writes the logs of the sshd application to a file named sshd-message , then discards the event so that it does not recur elsewhere. You can test this example by adding it to your rsyslog.conf file.
:programname,isequal, “sshd” /var/log/sshd-messages
&~
Use a command line tool like awk to extract the value of a specific field , such as sshd username. Below is an example from Ubuntu system.
$ awk'/sshd.*invalid user/ { print $9 }' /var/log/auth.log
guest
admin
info
test
ubnt
Use the log management system to automatically parse the logs, and then click Filter on the required application name. Below is a screenshot of the syslog domain extracted from the Loggly log management service. We filter the application name "sshd",
How to filter errors
What a person most wants to see in the log mistake. Unfortunately, the default syslog configuration does not directly output the severity of errors, making it difficult to filter them.
Here are two ways to solve this problem. First, you can modify your rsyslog configuration to output the error severity in the log file, making it easier to view and retrieve. In your rsyslog configuration you can add a template using pri-text like this: "< %pri-text %>: %timegenerated%,%HOSTNAME%,%syslogtag%,%msg%n"
This example will be output in the following format. You can see the
err indicating the error in the message.
You can use
awk or grep Retrieve error information. In Ubuntu , for this example, we can use some syntax features, such as . and >, which will only match this domain. $ grep '.err>'/var/log/auth.log
syslog messages and extract error fields. They also allow you to filter log messages for specific errors with a simple click.
shows the
syslog field that highlights the error severity, indicating that we are filtering errors .Free access to Brothers IT Education’s original linux operation and maintenance engineer video/details on linux Tutorials, please contact the official website customer service for details: http://www.lampbrother.net/linux/
Learn PHP, Linux, HTML5, UI, Android and other video tutorials (courseware + notes + videos)! Contact Q2430675018Welcome to join the Linux communication group Group number: 478068715
|

Hot AI Tools

Undresser.AI Undress
AI-powered app for creating realistic nude photos

AI Clothes Remover
Online AI tool for removing clothes from photos.

Undress AI Tool
Undress images for free

Clothoff.io
AI clothes remover

AI Hentai Generator
Generate AI Hentai for free.

Hot Article

Hot Tools

Notepad++7.3.1
Easy-to-use and free code editor

SublimeText3 Chinese version
Chinese version, very easy to use

Zend Studio 13.0.1
Powerful PHP integrated development environment

Dreamweaver CS6
Visual web development tools

SublimeText3 Mac version
God-level code editing software (SublimeText3)

Hot Topics
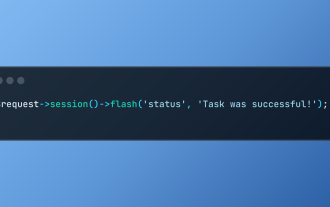
 Working with Flash Session Data in Laravel
Mar 12, 2025 pm 05:08 PM
Laravel simplifies handling temporary session data using its intuitive flash methods. This is perfect for displaying brief messages, alerts, or notifications within your application. Data persists only for the subsequent request by default: $request-
 cURL in PHP: How to Use the PHP cURL Extension in REST APIs
Mar 14, 2025 am 11:42 AM
The PHP Client URL (cURL) extension is a powerful tool for developers, enabling seamless interaction with remote servers and REST APIs. By leveraging libcurl, a well-respected multi-protocol file transfer library, PHP cURL facilitates efficient execution of various network protocols, including HTTP, HTTPS, and FTP. This extension offers granular control over HTTP requests, supports multiple concurrent operations, and provides built-in security features.
 Simplified HTTP Response Mocking in Laravel Tests
Mar 12, 2025 pm 05:09 PM
Laravel provides concise HTTP response simulation syntax, simplifying HTTP interaction testing. This approach significantly reduces code redundancy while making your test simulation more intuitive. The basic implementation provides a variety of response type shortcuts: use Illuminate\Support\Facades\Http; Http::fake([ 'google.com' => 'Hello World', 'github.com' => ['foo' => 'bar'], 'forge.laravel.com' =>
 12 Best PHP Chat Scripts on CodeCanyon
Mar 13, 2025 pm 12:08 PM
Do you want to provide real-time, instant solutions to your customers' most pressing problems? Live chat lets you have real-time conversations with customers and resolve their problems instantly. It allows you to provide faster service to your custom
 PHP Logging: Best Practices for PHP Log Analysis
Mar 10, 2025 pm 02:32 PM
PHP logging is essential for monitoring and debugging web applications, as well as capturing critical events, errors, and runtime behavior. It provides valuable insights into system performance, helps identify issues, and supports faster troubleshoot
 Explain the concept of late static binding in PHP.
Mar 21, 2025 pm 01:33 PM
Article discusses late static binding (LSB) in PHP, introduced in PHP 5.3, allowing runtime resolution of static method calls for more flexible inheritance.Main issue: LSB vs. traditional polymorphism; LSB's practical applications and potential perfo
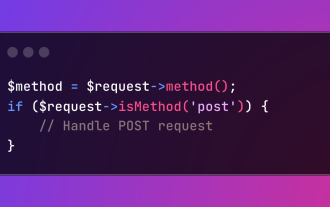
 HTTP Method Verification in Laravel
Mar 05, 2025 pm 04:14 PM
Laravel simplifies HTTP verb handling in incoming requests, streamlining diverse operation management within your applications. The method() and isMethod() methods efficiently identify and validate request types. This feature is crucial for building
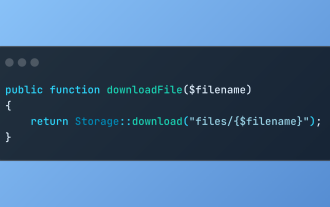
 Discover File Downloads in Laravel with Storage::download
Mar 06, 2025 am 02:22 AM
The Storage::download method of the Laravel framework provides a concise API for safely handling file downloads while managing abstractions of file storage. Here is an example of using Storage::download() in the example controller:


