 Backend Development
 PHP Tutorial
 windows installer clean up XDebug manual configuration and usage instructions under Windows
windows installer clean up XDebug manual configuration and usage instructions under Windows
1. Download the XDebug binary file: http://www.xdebug.org/download.php
5.2 http://www.xdebug.org/files/php_xdebug-2.1.0-5.2-vc6.dll
5.3 http: //www.xdebug.org/files/php_xdebug-2.1.0-5.3-vc6.dll
2. Find php.ini
3. If ZendOptimizer has been configured, you need to block ZendOptimizer related configuration first, usually as follows:
[Zend ]
zend_extension_manager.optimizer_ts="pathZendOptimizer-3.3.0libOptimizer-3.3.0"
zend_extensi
4. Add XDebug configuration:
zend_extensi
[Xdebug]
xdebug.profiler_enable=on
xdebug.trace_output_dir="pathxdebug"
xdebug.profiler_output_dir = "PATHXDEBUG"
xdebug.remote_enable = on
xdebug.remote_handler = dbgp
xdebug.remote_host = localhost
xdebug.remote_Port = 9000
Instructions: above "PATH" needs to be modified to your own local path.
5. Restart Apache or IIS.
6. Check the output of phpinfo. If you see the XDebug option, it means the configuration is successful.
The following are articles from other netizens
1. Install the xdebug module
1. Go to www.xdebug.org to download the corresponding version PHP module file, save the downloaded file to the ext directory of PHP. You can modify the name of the file yourself, such as saving it as: php_xdebug.dll
2. Modify php.ini and add the following information
Copy the code Code As follows:
[Xdebug]
zend_extensi
xdebug.auto_trace=on
xdebug.collect_params=on
xdebug.collect_return=on
xdebug.trace_output_dir="c:/webserver/php5/debuginfo"
xdebug.profiler_enable =on
xdebug.profiler_output_dir="c:/webserver/php5/debuginfo"
Parameter explanation:
zend_extensi
; Load xdebug module. You cannot load it with extension=php_xdebug.dll here. You must load it with zend. Otherwise, phpinfo will not display the xdebug item after installation.
xdebug.auto_trace=on;
;Automatically turn on the "monitoring function call process" function mode. This function can output the monitoring information of function calls in the form of a file in the directory you specify. The default value of this configuration item is off.
xdebug.collect_params=on;
;Turn on the function of collecting "function parameters". Include the parameter values of the function call in the monitoring information of the function procedure call. The default value of this configuration item is off.
xdebug.collect_return=on
; Turn on the function of collecting "function return value". Include the return value of the function in the monitoring information of the function procedure call. The default value of this configuration item is off.
xdebug.trace_output_dir="c:Tempxdebug"
;Set the path to the output file of function call monitoring information.
xdebug.profiler_enable=on
;Turn on the performance monitor.
xdebug.profiler_output_dir=”c:Tempxdebug”;
;Set the path to the performance monitoring information output file.
There are also some more specific parameter settings, see: http://www.xdebug.org/docs-settings.php
3. Restart apache
In this way, when running php locally, the settings will be Some debugging information files are generated in the directory:
The file name format of the function call process monitoring information file: trace.××××××.xt. This file can be viewed directly, and it contains information such as the running time of the function, parameter values of the function call, return value, file and location, etc. The content format is relatively intuitive.
The file name format of the performance monitoring file: cachegrind.out.××××××××.
This file can also be viewed directly, but the information format is not easy for humans to understand,
So we need the next software.
2. Install wincachegrind
Since the content of the performance monitoring file: cachegrind.out.×××××××× file is not easy to be understood by humans, we need a tool to read it. There is such a software under windows: wincachegrind.
1. Go to http://sourceforge.net/projects/wincachegrind/ to download and install wincachegrind
2. After installation and running, click Tools->options and set your working folder (the value of xdebug.profiler_output_dir in php.ini)
In this way, you can view the information of the performance monitoring file more intuitively.
The above introduces the manual configuration and usage instructions of XDebug under Windows installer clean up, including the contents of windows installer clean up. I hope it will be helpful to friends who are interested in PHP tutorials.

Hot AI Tools

Undresser.AI Undress
AI-powered app for creating realistic nude photos

AI Clothes Remover
Online AI tool for removing clothes from photos.

Undress AI Tool
Undress images for free

Clothoff.io
AI clothes remover

AI Hentai Generator
Generate AI Hentai for free.

Hot Article

Hot Tools

Notepad++7.3.1
Easy-to-use and free code editor

SublimeText3 Chinese version
Chinese version, very easy to use

Zend Studio 13.0.1
Powerful PHP integrated development environment

Dreamweaver CS6
Visual web development tools

SublimeText3 Mac version
God-level code editing software (SublimeText3)

Hot Topics
 Working with Flash Session Data in Laravel
Mar 12, 2025 pm 05:08 PM
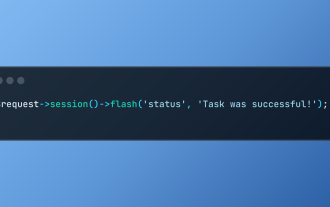
Laravel simplifies handling temporary session data using its intuitive flash methods. This is perfect for displaying brief messages, alerts, or notifications within your application. Data persists only for the subsequent request by default: $request-
 cURL in PHP: How to Use the PHP cURL Extension in REST APIs
Mar 14, 2025 am 11:42 AM
The PHP Client URL (cURL) extension is a powerful tool for developers, enabling seamless interaction with remote servers and REST APIs. By leveraging libcurl, a well-respected multi-protocol file transfer library, PHP cURL facilitates efficient execution of various network protocols, including HTTP, HTTPS, and FTP. This extension offers granular control over HTTP requests, supports multiple concurrent operations, and provides built-in security features.
 Build a React App With a Laravel Back End: Part 2, React
Mar 04, 2025 am 09:33 AM
This is the second and final part of the series on building a React application with a Laravel back-end. In the first part of the series, we created a RESTful API using Laravel for a basic product-listing application. In this tutorial, we will be dev
 Simplified HTTP Response Mocking in Laravel Tests
Mar 12, 2025 pm 05:09 PM
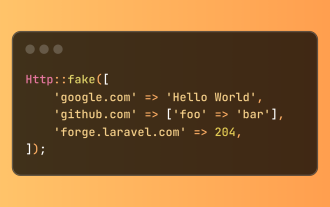
Laravel provides concise HTTP response simulation syntax, simplifying HTTP interaction testing. This approach significantly reduces code redundancy while making your test simulation more intuitive. The basic implementation provides a variety of response type shortcuts: use Illuminate\Support\Facades\Http; Http::fake([ 'google.com' => 'Hello World', 'github.com' => ['foo' => 'bar'], 'forge.laravel.com' =>
 12 Best PHP Chat Scripts on CodeCanyon
Mar 13, 2025 pm 12:08 PM
Do you want to provide real-time, instant solutions to your customers' most pressing problems? Live chat lets you have real-time conversations with customers and resolve their problems instantly. It allows you to provide faster service to your custom
 Notifications in Laravel
Mar 04, 2025 am 09:22 AM
In this article, we're going to explore the notification system in the Laravel web framework. The notification system in Laravel allows you to send notifications to users over different channels. Today, we'll discuss how you can send notifications ov
 Explain the concept of late static binding in PHP.
Mar 21, 2025 pm 01:33 PM
Article discusses late static binding (LSB) in PHP, introduced in PHP 5.3, allowing runtime resolution of static method calls for more flexible inheritance.Main issue: LSB vs. traditional polymorphism; LSB's practical applications and potential perfo
 PHP Logging: Best Practices for PHP Log Analysis
Mar 10, 2025 pm 02:32 PM
PHP logging is essential for monitoring and debugging web applications, as well as capturing critical events, errors, and runtime behavior. It provides valuable insights into system performance, helps identify issues, and supports faster troubleshoot


