
 Web Front-end
JS Tutorial
Implementing mouse click navigation menu water wave animation effect based on jQuery with source code download_jquery
Web Front-end
JS Tutorial
Implementing mouse click navigation menu water wave animation effect based on jQuery with source code download_jquery
Implementing mouse click navigation menu water wave animation effect based on jQuery with source code download_jquery

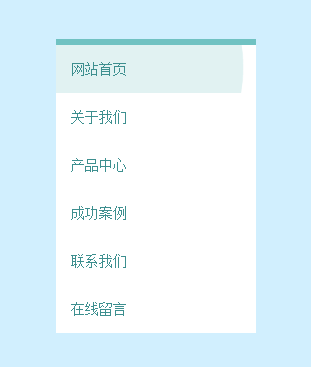
Based on jQuery mouse click water wave animation vertical navigation code. This is a vertical navigation bar effect with animation based on jQuery+CSS3. The rendering is as follows:
Effect display Source code download
html code:
<div class="nav">
  <ul>
   <li><a>网站首页</a></li>
   <li><a>关于我们</a></li>
   <li><a>产品中心</a></li>
   <li><a>成功案例</a></li>
   <li><a>联系我们</a></li>
   <li><a>在线留言</a></li>
  </ul>
 </div>
 <script type="text/javascript" src="js/jquery.min.js"></script>
 <script type="text/javascript">
  //jQuery time
  var parent, ink, d, x, y;
  $(".nav ul li a").click(function (e) {
   parent = $(this).parent();
   //create .ink element if it doesn't exist
   if (parent.find(".ink").length == 0)
    parent.prepend("<span class='ink'></span>");
   ink = parent.find(".ink");
   //incase of quick double clicks stop the previous animation
   ink.removeClass("animate");
   //set size of .ink
   if (!ink.height() && !ink.width()) {
    //use parent's width or height whichever is larger for the diameter to make a circle which can cover the entire element.
    d = Math.max(parent.outerWidth(), parent.outerHeight());
    ink.css({ height: d, width: d });
   }
   //get click coordinates
   //logic = click coordinates relative to page - parent's position relative to page - half of self height/width to make it controllable from the center;
   x = e.pageX - parent.offset().left - ink.width() / 2;
   y = e.pageY - parent.offset().top - ink.height() / 2;
   //set the position and add class .animate
   ink.css({ top: y + 'px', left: x + 'px' }).addClass("animate");
  })
</script>The above code is the core code of this article. It is relatively simple. You can add and delete the code appropriately according to your needs.

Hot AI Tools

Undresser.AI Undress
AI-powered app for creating realistic nude photos

AI Clothes Remover
Online AI tool for removing clothes from photos.

Undress AI Tool
Undress images for free

Clothoff.io
AI clothes remover

AI Hentai Generator
Generate AI Hentai for free.

Hot Article
Hot Tools

Notepad++7.3.1
Easy-to-use and free code editor

SublimeText3 Chinese version
Chinese version, very easy to use

Zend Studio 13.0.1
Powerful PHP integrated development environment

Dreamweaver CS6
Visual web development tools

SublimeText3 Mac version
God-level code editing software (SublimeText3)
Hot Topics
 1378
1378
 52
52

 How do I create and publish my own JavaScript libraries?
Mar 18, 2025 pm 03:12 PM
How do I create and publish my own JavaScript libraries?
Mar 18, 2025 pm 03:12 PM
Article discusses creating, publishing, and maintaining JavaScript libraries, focusing on planning, development, testing, documentation, and promotion strategies.
 How do I optimize JavaScript code for performance in the browser?
Mar 18, 2025 pm 03:14 PM
How do I optimize JavaScript code for performance in the browser?
Mar 18, 2025 pm 03:14 PM
The article discusses strategies for optimizing JavaScript performance in browsers, focusing on reducing execution time and minimizing impact on page load speed.
 What should I do if I encounter garbled code printing for front-end thermal paper receipts?
Apr 04, 2025 pm 02:42 PM
What should I do if I encounter garbled code printing for front-end thermal paper receipts?
Apr 04, 2025 pm 02:42 PM
Frequently Asked Questions and Solutions for Front-end Thermal Paper Ticket Printing In Front-end Development, Ticket Printing is a common requirement. However, many developers are implementing...
 How do I debug JavaScript code effectively using browser developer tools?
Mar 18, 2025 pm 03:16 PM
How do I debug JavaScript code effectively using browser developer tools?
Mar 18, 2025 pm 03:16 PM
The article discusses effective JavaScript debugging using browser developer tools, focusing on setting breakpoints, using the console, and analyzing performance.
 Who gets paid more Python or JavaScript?
Apr 04, 2025 am 12:09 AM
Who gets paid more Python or JavaScript?
Apr 04, 2025 am 12:09 AM
There is no absolute salary for Python and JavaScript developers, depending on skills and industry needs. 1. Python may be paid more in data science and machine learning. 2. JavaScript has great demand in front-end and full-stack development, and its salary is also considerable. 3. Influencing factors include experience, geographical location, company size and specific skills.
 How do I use source maps to debug minified JavaScript code?
Mar 18, 2025 pm 03:17 PM
How do I use source maps to debug minified JavaScript code?
Mar 18, 2025 pm 03:17 PM
The article explains how to use source maps to debug minified JavaScript by mapping it back to the original code. It discusses enabling source maps, setting breakpoints, and using tools like Chrome DevTools and Webpack.
 Getting Started With Chart.js: Pie, Doughnut, and Bubble Charts
Mar 15, 2025 am 09:19 AM
Getting Started With Chart.js: Pie, Doughnut, and Bubble Charts
Mar 15, 2025 am 09:19 AM
This tutorial will explain how to create pie, ring, and bubble charts using Chart.js. Previously, we have learned four chart types of Chart.js: line chart and bar chart (tutorial 2), as well as radar chart and polar region chart (tutorial 3). Create pie and ring charts Pie charts and ring charts are ideal for showing the proportions of a whole that is divided into different parts. For example, a pie chart can be used to show the percentage of male lions, female lions and young lions in a safari, or the percentage of votes that different candidates receive in the election. Pie charts are only suitable for comparing single parameters or datasets. It should be noted that the pie chart cannot draw entities with zero value because the angle of the fan in the pie chart depends on the numerical size of the data point. This means any entity with zero proportion
 The difference in console.log output result: Why are the two calls different?
Apr 04, 2025 pm 05:12 PM
The difference in console.log output result: Why are the two calls different?
Apr 04, 2025 pm 05:12 PM
In-depth discussion of the root causes of the difference in console.log output. This article will analyze the differences in the output results of console.log function in a piece of code and explain the reasons behind it. �...
