VS2013 development and debugging PHP extension
Reprinted from: http://blog.csdn.net/a600423444/article/details/12720543
Foreword
An essential part of development is debugging, and the way of debugging directly affects development efficiency and Software quality.
When I developed PHP extensions before, I never knew how to debug. Every time I debugged, I recompiled, executed and then ran the PHP script to check the running status before debugging. It's too painful and affects efficiency too much. I also searched on Baidu and Google about how to debug PHP extensions, but the answers were almost all GDB. Unfortunately, I don’t know how to actually operate it.
VS is not used much, and I don’t know what many of its functions are for. A few days ago, a colleague said that you can use VS’s “Attach to Process” to debug PHP extensions. I suddenly felt like I was saved. Of course, it's also because I'm not familiar with C debugging.
Enter the topic:
1. Building a PHP extension development environment for Windows
Check out my other article: http://blog.csdn.net/a600423444/article/details/8108993The article introduces PHP5. The construction method of 4 is similar if you want to change to PHP5.5, and the steps are the same.
2. Configure the debugging environment
1. Download the PHP_DEBUG_PACK file
http://windows.php.net/download/#php-5.4
When selecting, please note that it must be the same as the downloaded PHP binary version. For example, when you set up the PHP development environment in the first step, you selected VC9 x86 Non Thread Safe, then DEBUG PACK should download the same version of DEBUG PACK.
2. Introduce symbol files
The Debug pack compressed package contains all PHP debugging related symbol files (*.pdb), and introducing them is the key to debugging.
Note: Only in debugging state, the Load all symbols button can be clicked
Tools-"Options-"Debugging-"Symbols-"Add the decompression path to the symbol location

3. Extension to enable DEBUG information
Project-》Properties-》Linker-》Debugging-》Generate debug information-》Set to "Yes"

When compiling and generating the Release version DLL, it will Generate vc110.pdb and put it into the PDB path decompressed earlier. In order to unify the naming format, you can rename it with the same name as the extension. What I changed here is "php_test.pdb"

Now the configuration has been completed, let's see how to use debugging.
3. Attach to the process
1. Write a PHP script and run it in the terminal as a permanent process.
[php] view
plaincopy
- while(1){
- '11'); sleep( 4);
- }
2. Add breakpoint location

3. Attach process
Debugging - "Attach to process: Select the process generated by executing PHP in 1 above.

Now, just wait for the program to run to the breakpoint location to see the debugging information:

Over.
The above introduces the development and debugging of PHP extensions in VS2013, including aspects of the content. I hope it will be helpful to friends who are interested in PHP tutorials.

Hot AI Tools

Undresser.AI Undress
AI-powered app for creating realistic nude photos

AI Clothes Remover
Online AI tool for removing clothes from photos.

Undress AI Tool
Undress images for free

Clothoff.io
AI clothes remover

AI Hentai Generator
Generate AI Hentai for free.

Hot Article

Hot Tools

Notepad++7.3.1
Easy-to-use and free code editor

SublimeText3 Chinese version
Chinese version, very easy to use

Zend Studio 13.0.1
Powerful PHP integrated development environment

Dreamweaver CS6
Visual web development tools

SublimeText3 Mac version
God-level code editing software (SublimeText3)

Hot Topics
 CakePHP Project Configuration
Sep 10, 2024 pm 05:25 PM
In this chapter, we will understand the Environment Variables, General Configuration, Database Configuration and Email Configuration in CakePHP.
 PHP 8.4 Installation and Upgrade guide for Ubuntu and Debian
Dec 24, 2024 pm 04:42 PM
PHP 8.4 brings several new features, security improvements, and performance improvements with healthy amounts of feature deprecations and removals. This guide explains how to install PHP 8.4 or upgrade to PHP 8.4 on Ubuntu, Debian, or their derivati
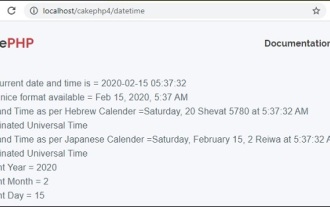 CakePHP Date and Time
Sep 10, 2024 pm 05:27 PM
To work with date and time in cakephp4, we are going to make use of the available FrozenTime class.
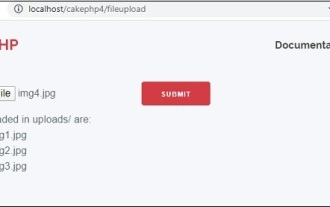 CakePHP File upload
Sep 10, 2024 pm 05:27 PM
To work on file upload we are going to use the form helper. Here, is an example for file upload.
 Discuss CakePHP
Sep 10, 2024 pm 05:28 PM
CakePHP is an open-source framework for PHP. It is intended to make developing, deploying and maintaining applications much easier. CakePHP is based on a MVC-like architecture that is both powerful and easy to grasp. Models, Views, and Controllers gu
 CakePHP Routing
Sep 10, 2024 pm 05:25 PM
In this chapter, we are going to learn the following topics related to routing ?
 CakePHP Working with Database
Sep 10, 2024 pm 05:25 PM
Working with database in CakePHP is very easy. We will understand the CRUD (Create, Read, Update, Delete) operations in this chapter.
 CakePHP Creating Validators
Sep 10, 2024 pm 05:26 PM
Validator can be created by adding the following two lines in the controller.


