
 Web Front-end
HTML Tutorial
Use WeChat web developer tools to debug WeChat enterprise account page (front-end page)
Web Front-end
HTML Tutorial
Use WeChat web developer tools to debug WeChat enterprise account page (front-end page)
Use WeChat web developer tools to debug WeChat enterprise account page (front-end page)

A few days ago, I wrote an article about using fiddler to debug WeChat pages. Then a blogger commented that using fiddler was too troublesome. He recommended using WeChat web developer tools to debug WeChat pages. I have been playing with it in the past two days and it is very powerful. This article is just a record so that you can read it when you use it in the future. Please criticize and correct any mistakes. Insert the official WeChat web developer tool download link and document description https://mp.weixin.qq.com/wiki/10/e5f772f4521da17fa0d7304f68b97d7e.html. Referring to this document, I have added some details. Just install it directly after downloading.
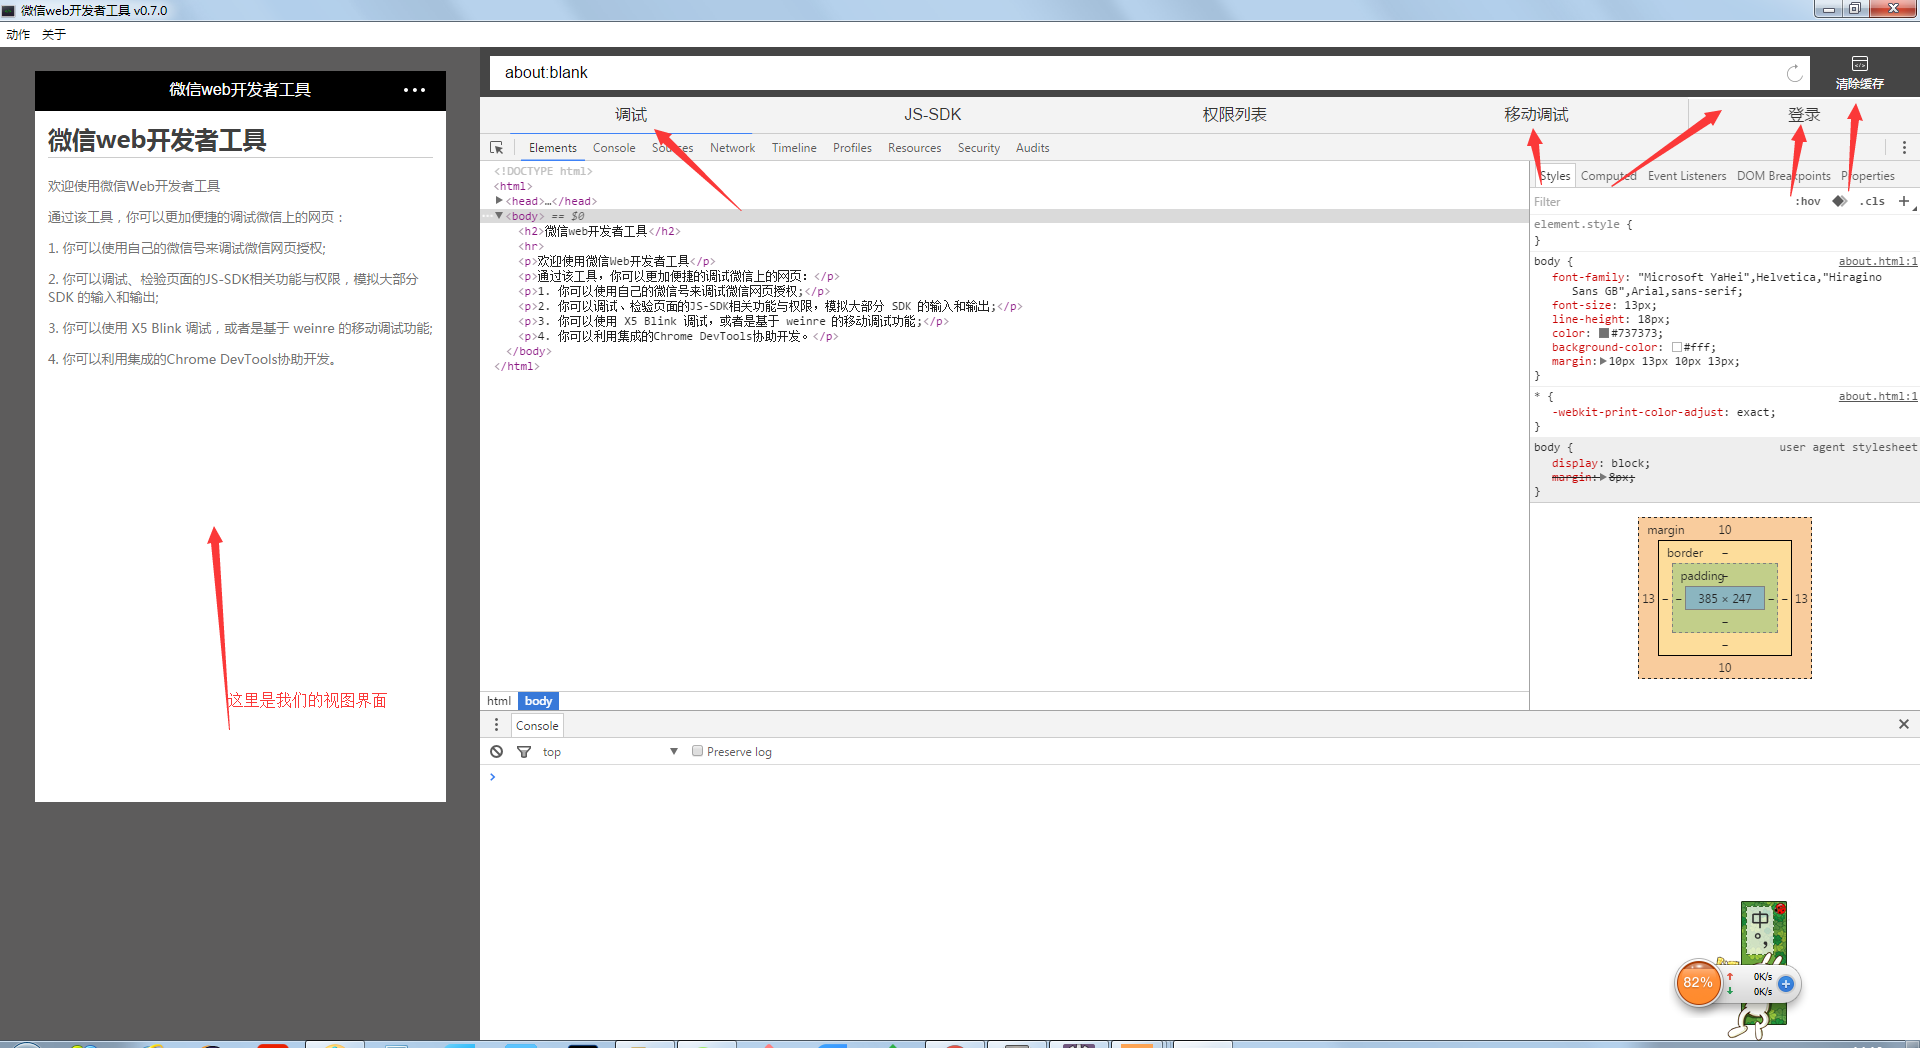
1. After downloading and installing, the interface will look like this.
2. When we click to log in, the scan QR code page will appear. Just scan it with your own WeChat to log in

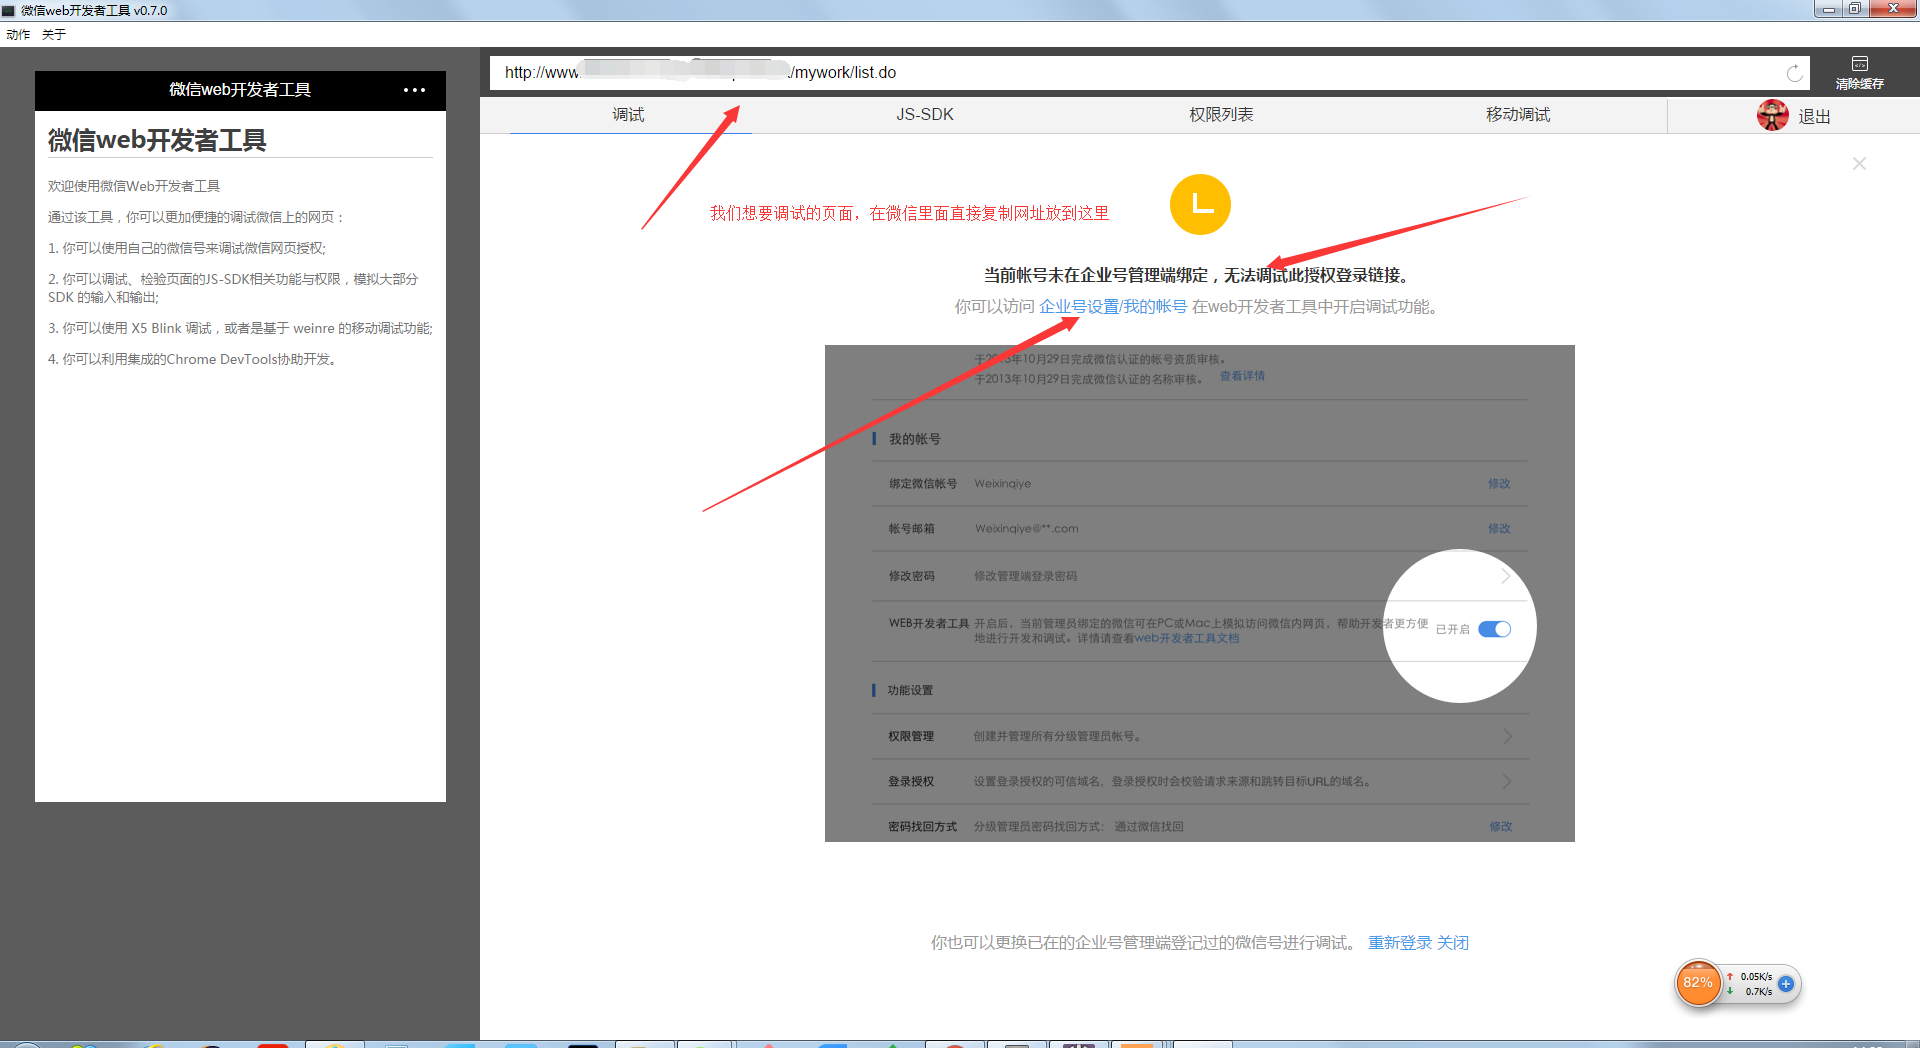
3. After logging in, you can debug our WeChat enterprise account page, Please pay attention! ! ! To debug the current enterprise account page, the WeChat ID you log in must be the administrator of this enterprise account (this is written in the documentation of the WeChat developer tool). If not, please go to the development end of your enterprise account. Set your WeChat account as administrator. Otherwise, the following page will appear in the developer tools, as shown in the picture
The administrator setting interface is as shown in the picture:

After adding the enterprise account management page, there will be a reminder on your mobile phone WeChat. Remember to set the login password for the developer tools according to the reminder. If you do not set a password, you still cannot log in, as shown in the picture:

After setting the password, we clicked to log in and found that we still couldn’t log in, as shown in the picture:

After clicking in, as shown in the picture:

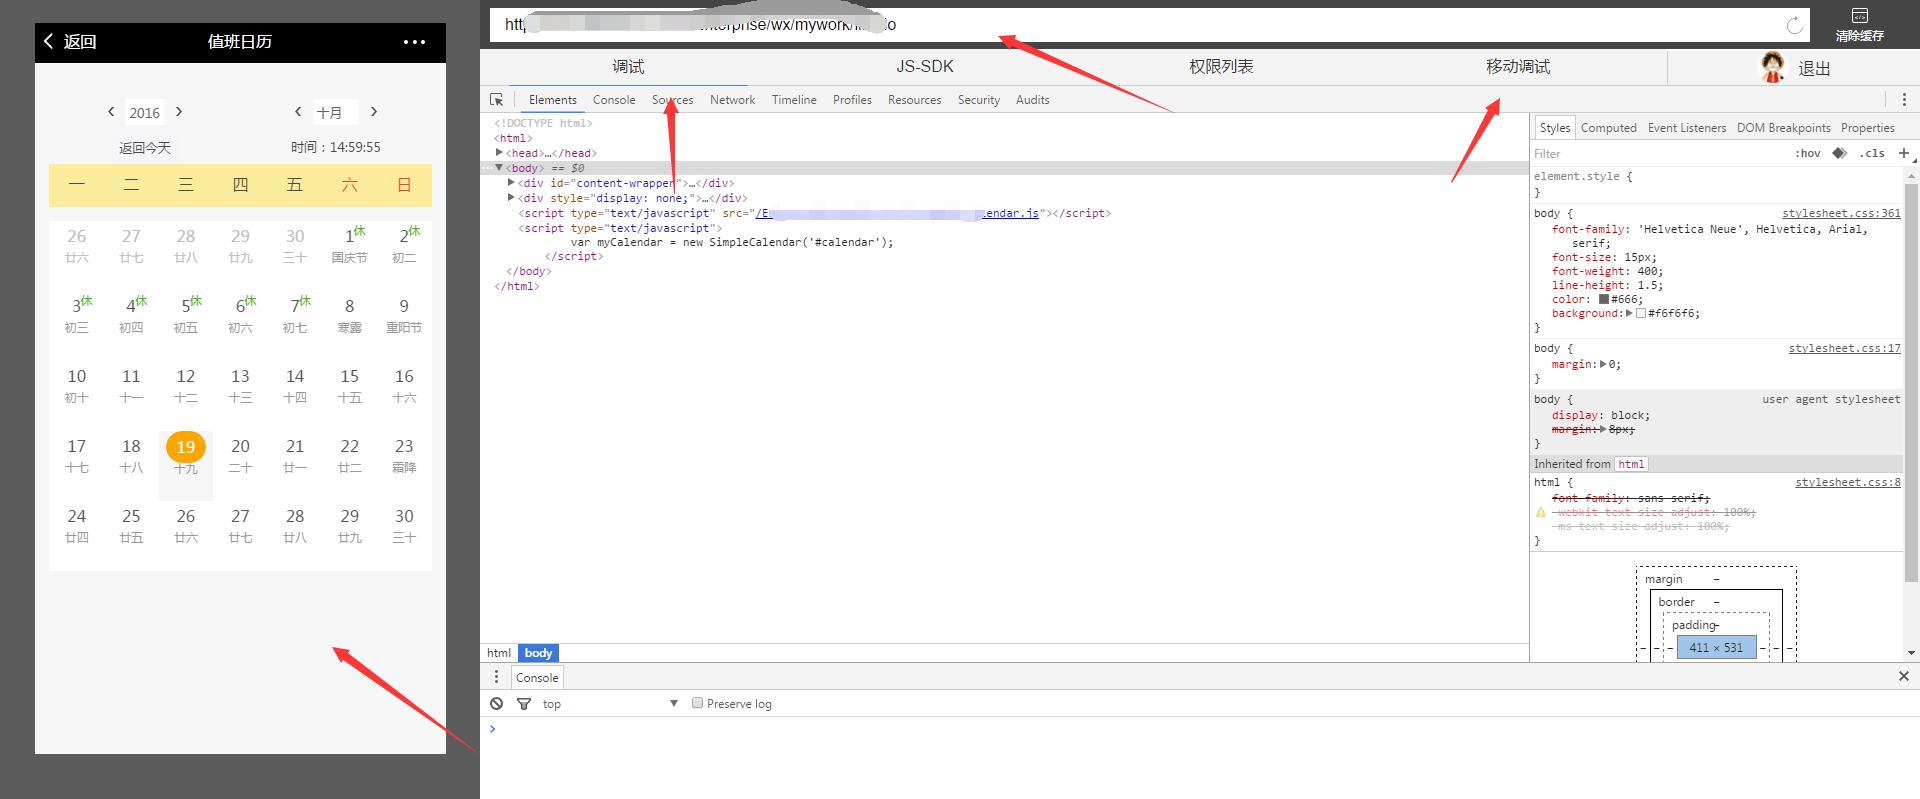
2. After all the above settings are set, we log in to the development tool, open a public account page at will, copy the link and put it in the address bar of the development tool. Now we can basically debug on the computer. The page is as shown in the picture: (pay attention to mobile debugging)
3. This tool has more powerful functions! Click Mobile Debugging in the window.
3-1. As shown in the picture, we first select Android device debugging - normal debugging,

Then we only need to follow his prompts - debugging steps to set up our mobile phone. The mobile phone proxy settings are as shown in the figure:

After setting up the proxy on your phone, just click Start debugging on the developer tools page. It is very powerful. The part of the page we selected will be displayed in real time on the phone. (Experience it yourself.)
3-2. As shown in the picture, we first select Android device debugging--X5 Blink kernel debugging, this function is more powerful!

This part is strongly recommended to read the documentation on the official website. I will copy it and put it here first.
Mobile Debugging
The performance of mobile web pages is usually different from that of desktop browsers, including the presentation of styles, the logic of scripts, etc., which will cause certain troubles to developers. Now, the WeChat Android client webview has begun to be fully upgraded to the X5 Blink kernel. The new kernel has made great progress in terms of rendering capabilities, API support and development assistance. Through the remote debugging function in the WeChat web developer tool, real-time mapping of the mobile phone screen to the WeChat web developer tool will help developers debug X5 Blink core web pages more efficiently. The specific steps are as follows:
(1) Preparation
1. Install WeChat web developer tools of version 0.5.0 or above
2. Confirm whether the mobile device supports remote debugging function
Open the WeChat web developer tools, select the "Mobile Debugging" tab, and click to verify whether the mobile device supports it. Then use your mobile device to scan the pop-up QR code to get support information on your device.
3. Turn on the USB debugging function in the mobile device
1. Open your mobile device and go to "Settings" -> "Developer Options"
2. Check "USB debugging function"

It should be noted that for devices after Android 4.2, the developer options are hidden by default. You can open them by following the following steps:
1. Open your mobile device and go to "Settings" -> "About Phone"
2. Find and click "Build Number" 7 times
4. Install mobile device USB driver
Usually developers can download relevant drivers from the official website of mobile device manufacturers, or use Tencent Mobile Manager to install device drivers.
5. Open the inspector function of X5 Blink kernel
Open the WeChat web developer tool, select the "Mobile Debugging" tab, and use your device to scan the QR code in "Debugging Steps".
As shown below, check "Whether to turn on the TBS kernel Inspector debugging function" and restart WeChat.
(2) Start debugging
After connecting the mobile device to a PC or Mac using a USB data cable, click to open the "Mobile Debugging" tab of the WeChat web developer tool and select the X5 Blink debugging function. A new window will open. Visit any web page in WeChat to start. debug. For more information about the X5 Blink core, you can view the official website introduction.
When all preparations are completed, the basic information of the current device can be seen in the window:
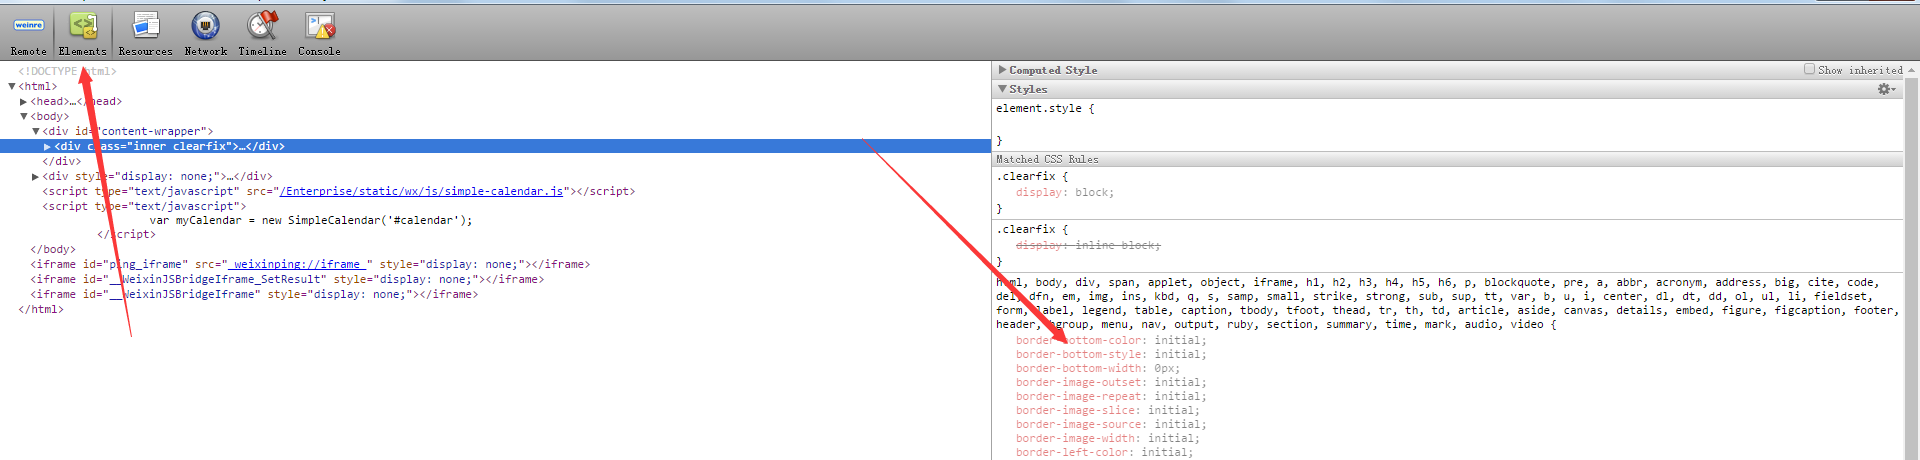
Click "inspect" on any page to open a new window. Developers will see the familiar debugging interface:
Click the "Mobile" icon in the upper right corner of the picture above to enable the screen mapping function:
Let me add something below:
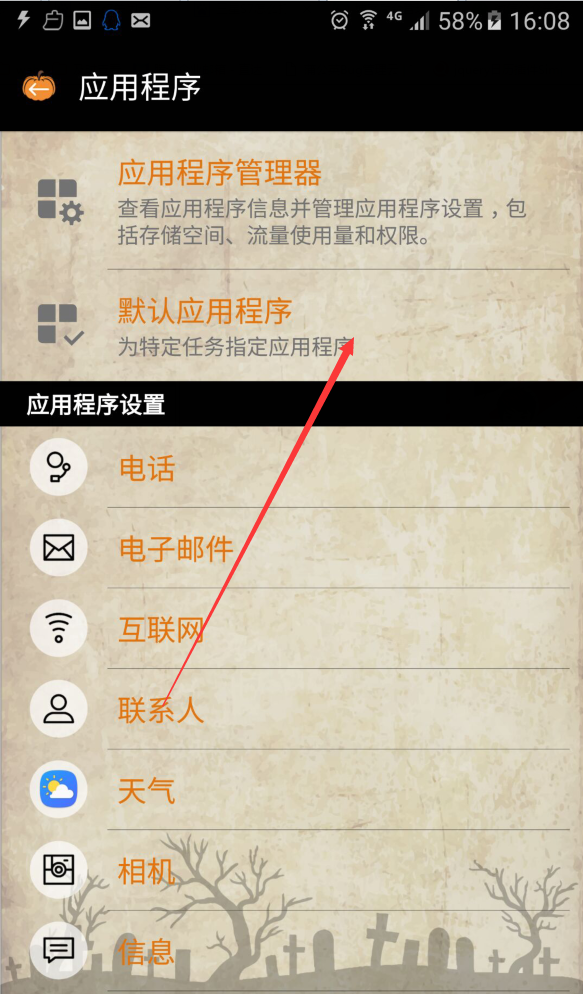
3-2-1. Turn on the debugging USB debugging function of our mobile phone. My mobile phone is a Samsung S7. (Higher versions of Android seem to do this. If yours doesn’t work, just ask Du Niang) I searched for a long time and couldn’t find it. I found it after asking Du Niang. . . . Write a record
Select settings in the drop-down notification bar, as shown in the picture:


Click a few more times on the version number, and there will be a reminder on the page. Click a few more times to open the developer options. After opening it, the developer options will appear in our settings. Click in and turn on USB debugging. .
Extra content----How to turn off developer options? ? ? As shown in the picture


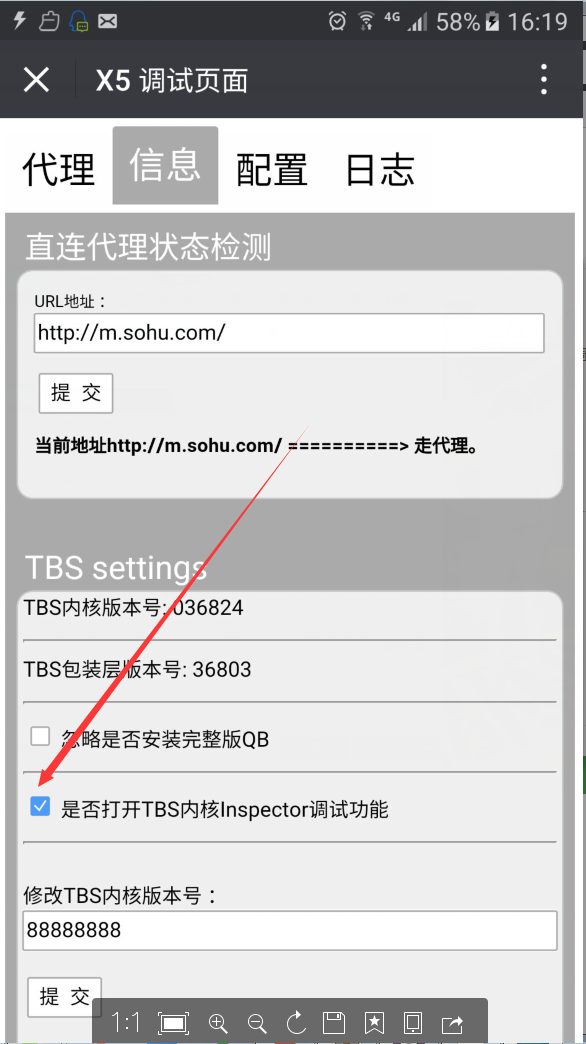
3-2-2Open the inspector function of X5 Blink kernel
Open the WeChat web developer tool, select the "Mobile Debugging" tab, and use your device to scan the QR code in "Debugging Steps". As shown below, check "Whether to turn on the TBS kernel Inspector debugging function" and restart WeChat.
3-2-3 Start debugging
After completing the above settings, click the Start Debugging button on the page. The following page will appear on the phone, as shown in the picture. We can click OK.

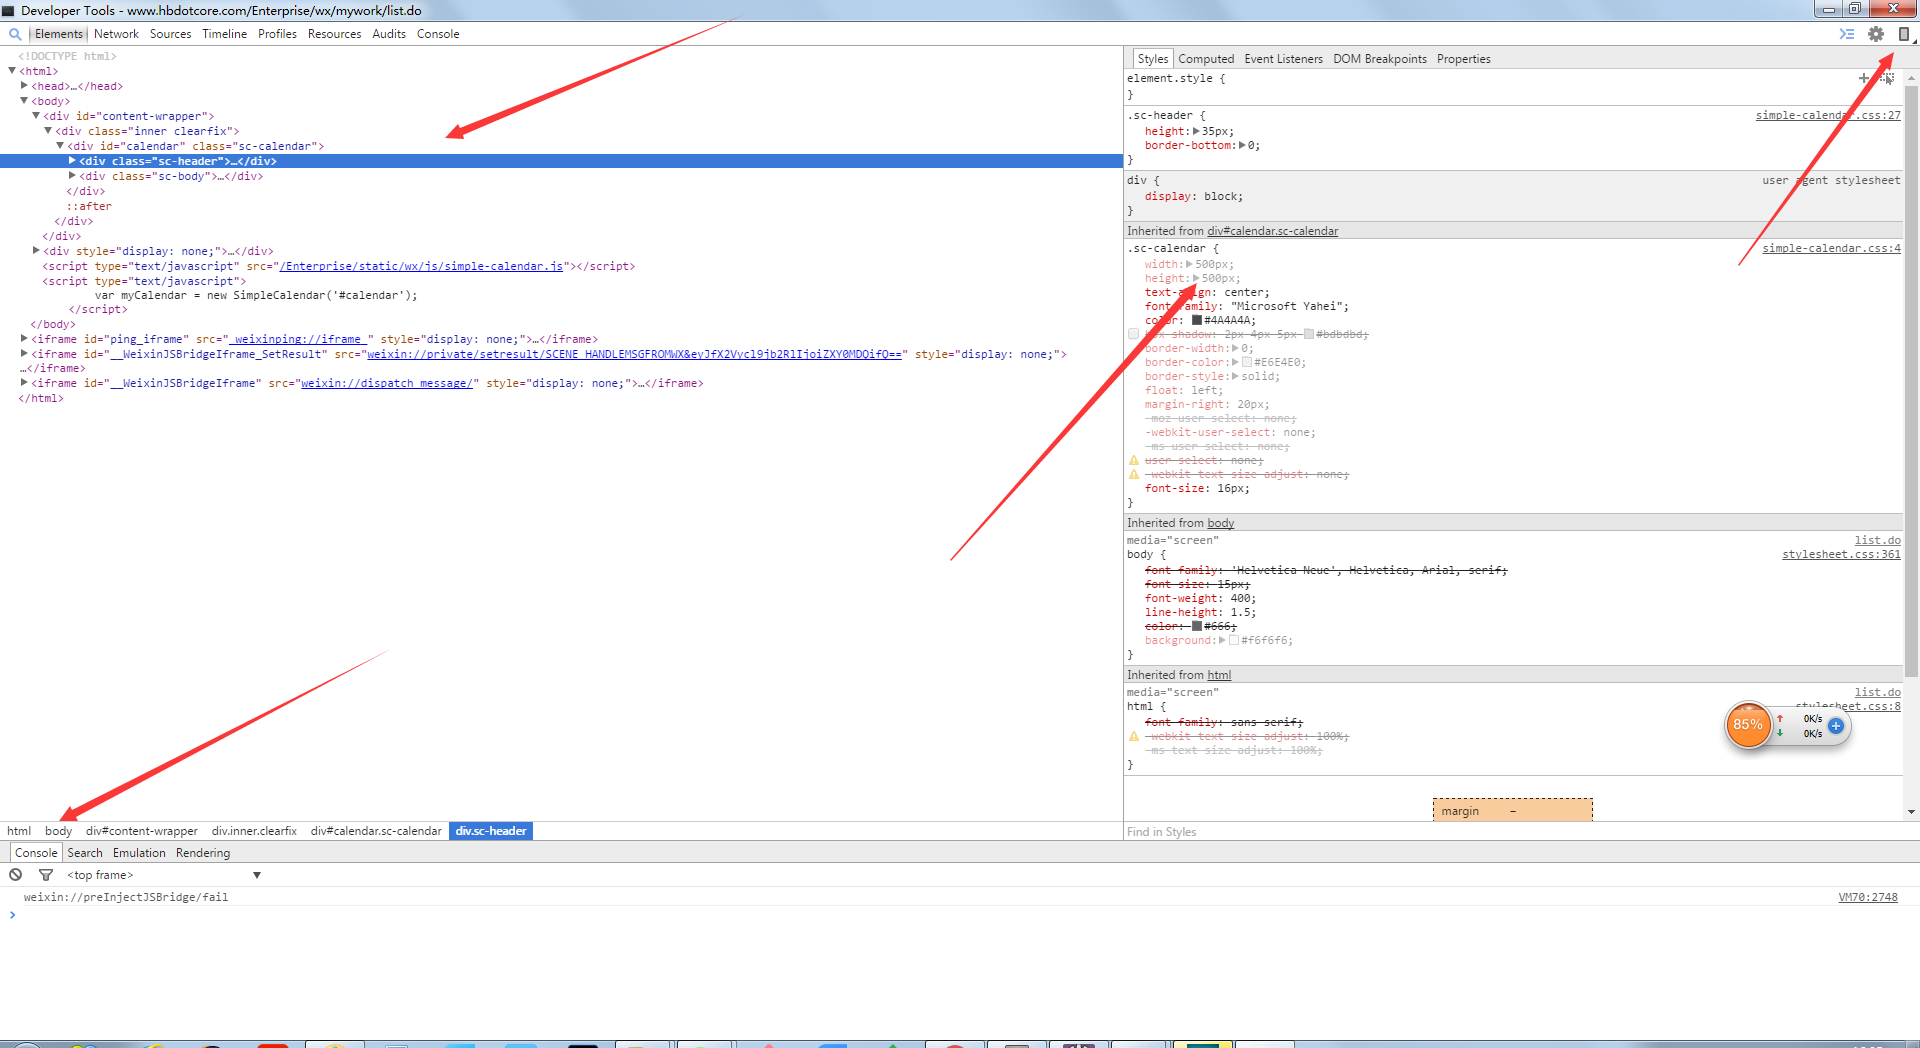
Then our debugging tool will pop up this page:

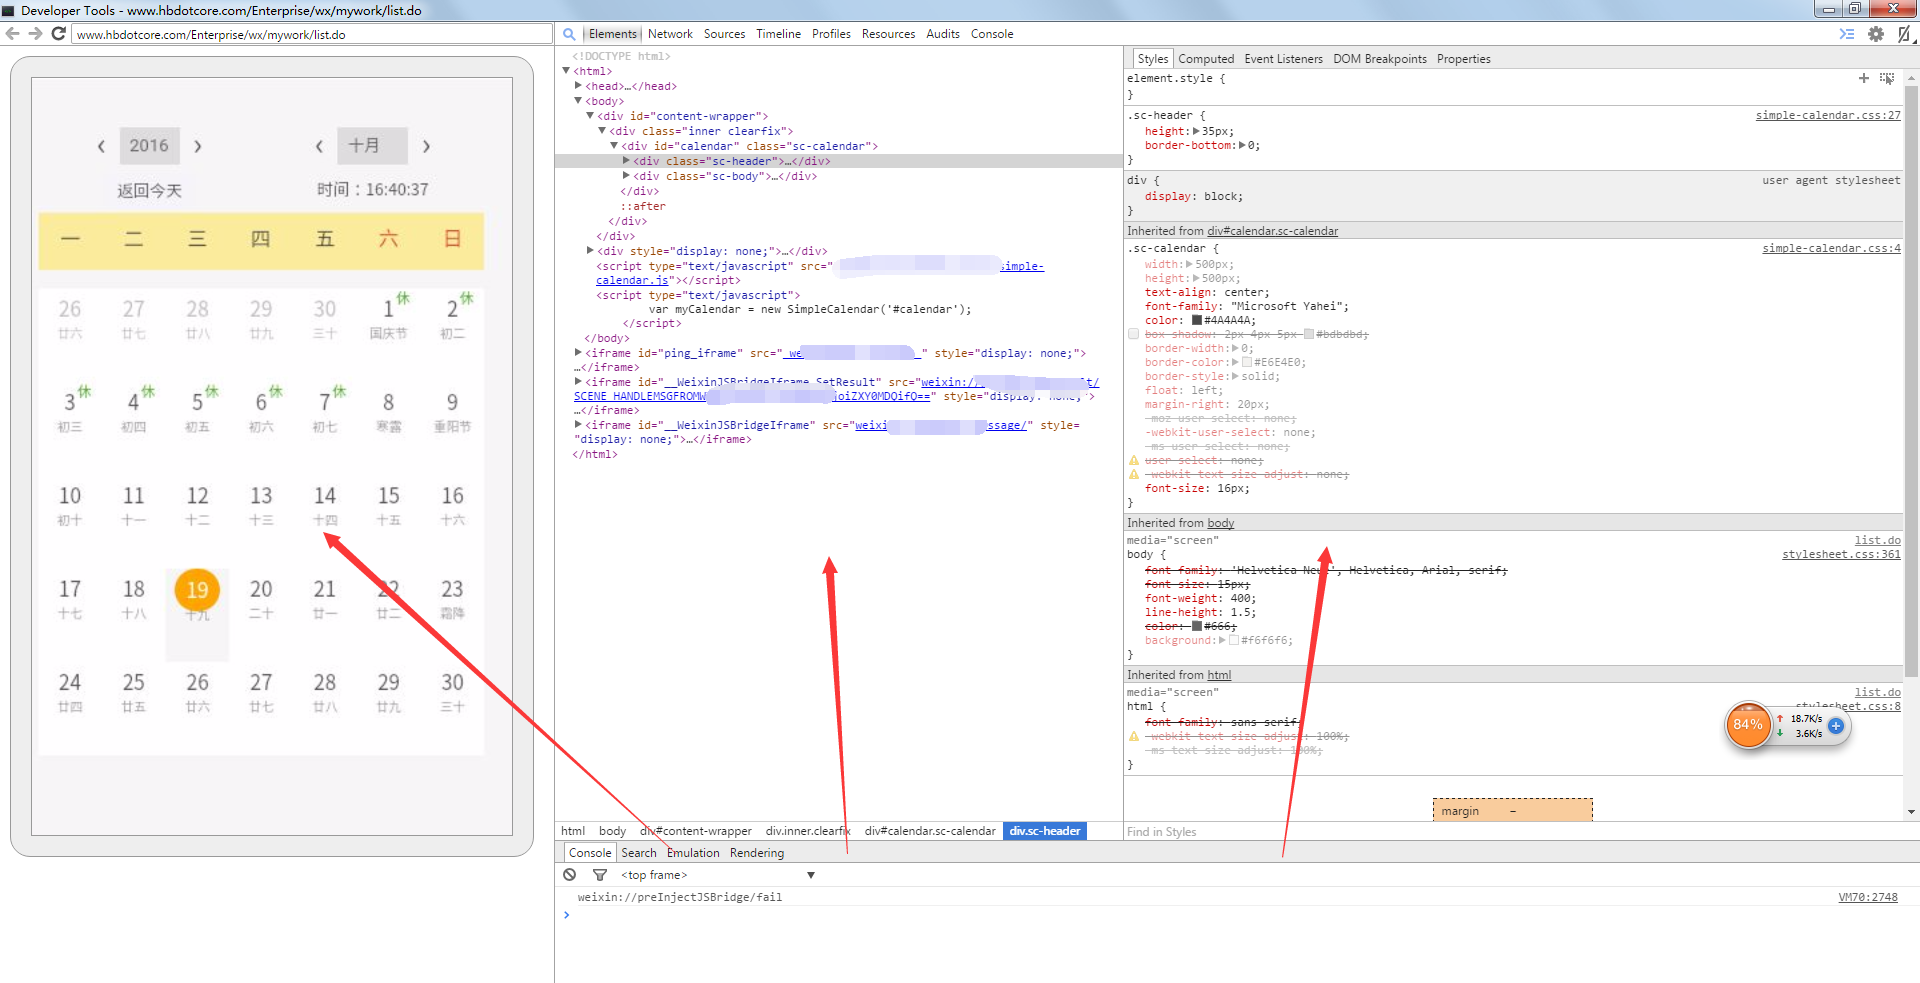
That’s basically it at this point. We can randomly open a page of the WeChat official account we want to debug on our mobile phone. As picture

After opening, it is as shown in the picture: The left side is our debugging tool page, and the right side is the page displayed on our mobile phone. Isn’t it great, hahahaha,

Click the mobile phone icon in the upper right corner of the debugging tool page to map the mobile phone page to the debugging tool, as shown in the figure:

Hot AI Tools

Undresser.AI Undress
AI-powered app for creating realistic nude photos

AI Clothes Remover
Online AI tool for removing clothes from photos.

Undress AI Tool
Undress images for free

Clothoff.io
AI clothes remover

Video Face Swap
Swap faces in any video effortlessly with our completely free AI face swap tool!

Hot Article
Hot Tools

Notepad++7.3.1
Easy-to-use and free code editor

SublimeText3 Chinese version
Chinese version, very easy to use

Zend Studio 13.0.1
Powerful PHP integrated development environment

Dreamweaver CS6
Visual web development tools

SublimeText3 Mac version
God-level code editing software (SublimeText3)
Hot Topics
 1389
1389
 52
52

 Is HTML easy to learn for beginners?
Apr 07, 2025 am 12:11 AM
Is HTML easy to learn for beginners?
Apr 07, 2025 am 12:11 AM
HTML is suitable for beginners because it is simple and easy to learn and can quickly see results. 1) The learning curve of HTML is smooth and easy to get started. 2) Just master the basic tags to start creating web pages. 3) High flexibility and can be used in combination with CSS and JavaScript. 4) Rich learning resources and modern tools support the learning process.
 The Roles of HTML, CSS, and JavaScript: Core Responsibilities
Apr 08, 2025 pm 07:05 PM
The Roles of HTML, CSS, and JavaScript: Core Responsibilities
Apr 08, 2025 pm 07:05 PM
HTML defines the web structure, CSS is responsible for style and layout, and JavaScript gives dynamic interaction. The three perform their duties in web development and jointly build a colorful website.
 What is an example of a starting tag in HTML?
Apr 06, 2025 am 12:04 AM
What is an example of a starting tag in HTML?
Apr 06, 2025 am 12:04 AM
AnexampleofastartingtaginHTMLis,whichbeginsaparagraph.StartingtagsareessentialinHTMLastheyinitiateelements,definetheirtypes,andarecrucialforstructuringwebpagesandconstructingtheDOM.
 Understanding HTML, CSS, and JavaScript: A Beginner's Guide
Apr 12, 2025 am 12:02 AM
Understanding HTML, CSS, and JavaScript: A Beginner's Guide
Apr 12, 2025 am 12:02 AM
WebdevelopmentreliesonHTML,CSS,andJavaScript:1)HTMLstructurescontent,2)CSSstylesit,and3)JavaScriptaddsinteractivity,formingthebasisofmodernwebexperiences.
 Gitee Pages static website deployment failed: How to troubleshoot and resolve single file 404 errors?
Apr 04, 2025 pm 11:54 PM
Gitee Pages static website deployment failed: How to troubleshoot and resolve single file 404 errors?
Apr 04, 2025 pm 11:54 PM
GiteePages static website deployment failed: 404 error troubleshooting and resolution when using Gitee...
 How to implement adaptive layout of Y-axis position in web annotation?
Apr 04, 2025 pm 11:30 PM
How to implement adaptive layout of Y-axis position in web annotation?
Apr 04, 2025 pm 11:30 PM
The Y-axis position adaptive algorithm for web annotation function This article will explore how to implement annotation functions similar to Word documents, especially how to deal with the interval between annotations...
 How to use CSS3 and JavaScript to achieve the effect of scattering and enlarging the surrounding pictures after clicking?
Apr 05, 2025 am 06:15 AM
How to use CSS3 and JavaScript to achieve the effect of scattering and enlarging the surrounding pictures after clicking?
Apr 05, 2025 am 06:15 AM
To achieve the effect of scattering and enlarging the surrounding images after clicking on the image, many web designs need to achieve an interactive effect: click on a certain image to make the surrounding...
 Why do you need to call Vue.use(VueRouter) in the index.js file under the router folder?
Apr 05, 2025 pm 01:03 PM
Why do you need to call Vue.use(VueRouter) in the index.js file under the router folder?
Apr 05, 2025 pm 01:03 PM
The necessity of registering VueRouter in the index.js file under the router folder When developing Vue applications, you often encounter problems with routing configuration. Special...
