
Comparison of renderings
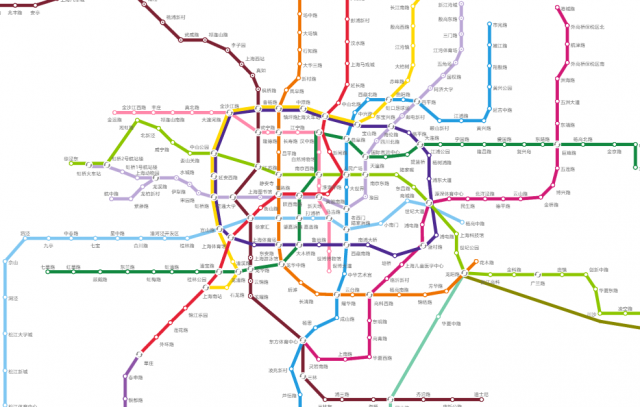
There are still a lot of subway maps online, so I chose this relatively new one for reference. I remember when my brother came to Shanghai to work hard, there was a red and a green cross on the picture... Not much to say about his age, just look at the picture:
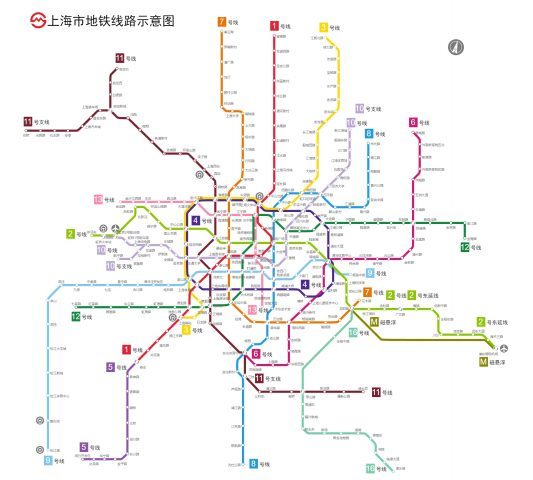
Let’s take a look at what I did:

I can't tell the difference at first glance, but this is not a rendering, but something that a novice made in just a few days, and many of the beautifications and adjustments were automatically completed through the program, which is not easy. More importantly, it is not a dead map, but a pure vector, interactive, dynamic effect, and distortion-free scaling topological map! Let’s take a brief look at the interaction effect first, and then we can talk about the implementation of the code in detail.
Text prompt pops up
First of all, move the mouse to the site, road section, icon, etc., and a text prompt will pop up. This is relatively basic, Baidu has it, so I put a relatively simple pop-up content. If you add basic introductions, related tips, peripheral information... If you add advertisements, you can make money... Anyway, you can add anything, it's just a setToolTip command.
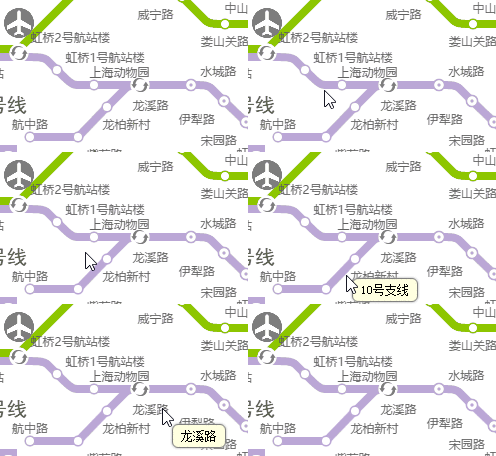
The site icon changes
When the mouse moves over the site, the site icon has a magnification effect. This effect is very considerate. I looked at the Baidu website and it uses a luminous effect.
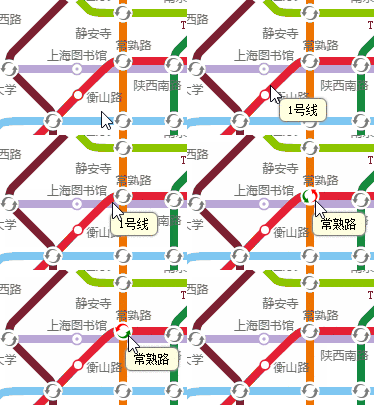
The implementation method is also very simple, that is, dynamic judgment is added when registering the site vector graphics. The following code registers vector graphics for ordinary sites:
twaver.Util.registerImage('station',{
    w: linkWidth*1.6,
    h: linkWidth*1.6,
    v: function (data, view) {
        var result = [];
        if(data.getClient('focus')){
            result.push({
                shape: 'circle',
                r: linkWidth*0.7,
                lineColor:  data.getClient('lineColor'),
                lineWidth: linkWidth*0.2,
                fill: 'white',
            });
            result.push({
                shape: 'circle',
                r: linkWidth*0.2,
                fill:  data.getClient('lineColor'),
            });
        }else{
            result.push({
                shape: 'circle',
                r: linkWidth*0.6,
                lineColor: data.getClient('lineColor'),
                lineWidth: linkWidth*0.2,
                fill: 'white',
            });
        }
        return result;
    }
});Animation effect drag
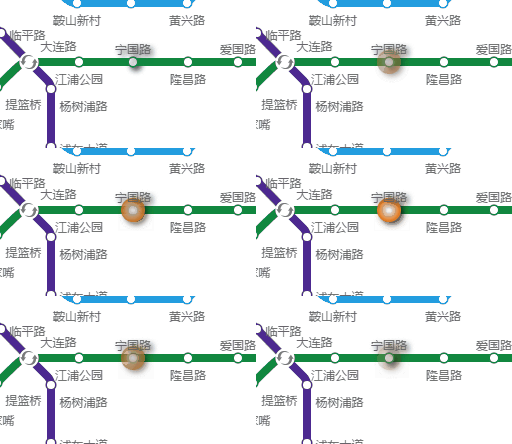
You can also see from the picture above that in addition to adding color to the transfer station icon, a rotation effect is also implemented. This one instantly beats Baidu. Let’s look at the code:
1.    twaver.Util.registerImage('rotateArrow', {
2.        w: 124,
3.        h: 124,
4.        v: [{
5.            shape: 'vector',
6.            name: 'doubleArrow',
7.            rotate: 360,
8.            animate: [{
9.                attr: 'rotate',
10.                to: 0,
11.                dur: 2000,
12.                reverse: false,
13.                repeat: Number.POSITIVE_INFINITY
14.            }]
15.        }]
16. });Of course this is also very easy for TWaver, it just dynamically changes the rotate attribute.
In addition, when clicking and double-clicking the site, the selected and loading animation effects are also implemented, which is worthy of praise!
Hybrid scaling, dazzling
Distortion-free scaling is the innate advantage of vector graphics, and I have mastered it very well. I have used TWaver’s hybrid scaling mode to the extreme, as well as small functions such as scaling ratio control and automatic text hiding. , easy to customize.
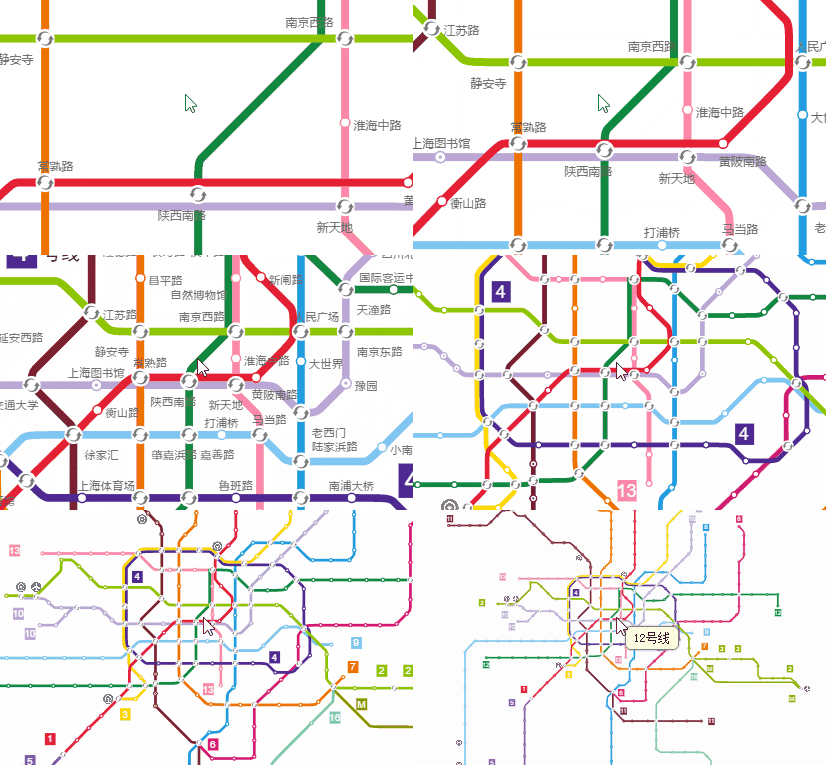
The code is not complicated either:
1.    network.setZoomManager(new twaver.vector.MixedZoomManager(network));
2.    network.setMinZoom(0.2);
3.    network.setMaxZoom(3);
4.    network.setZoomVisibilityThresholds({
5.        label : 0.6,
6. });交互功能用起来
小弟很自豪地给我介绍这个功能:图标可以自由拖动,松开后会自动弹回。哥问小弟这有什么用,他一本正经地说:证明图是活的!
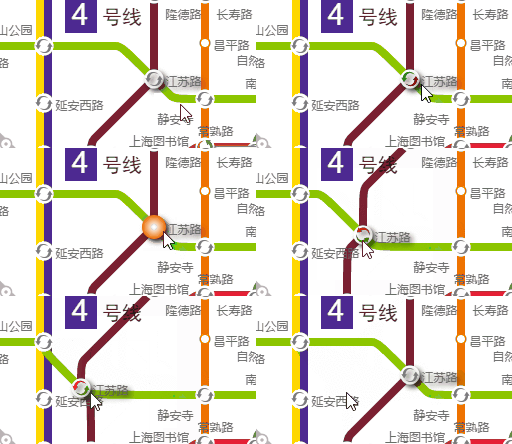
好吧你赢了,虽然是个没什么卵用的功能,但闲的蛋疼的时候可以随便玩上几十分钟我也是信的。
连续单击同一站点
连续单击同一站点(注意不是双击),可以将经过此站点的所有线路突出显示出来。小弟说加入这个功能纯粹因为简单易做,我……竟然表示非常理解,谁年轻时没耍过这类轻松又讨好的小招数呢?
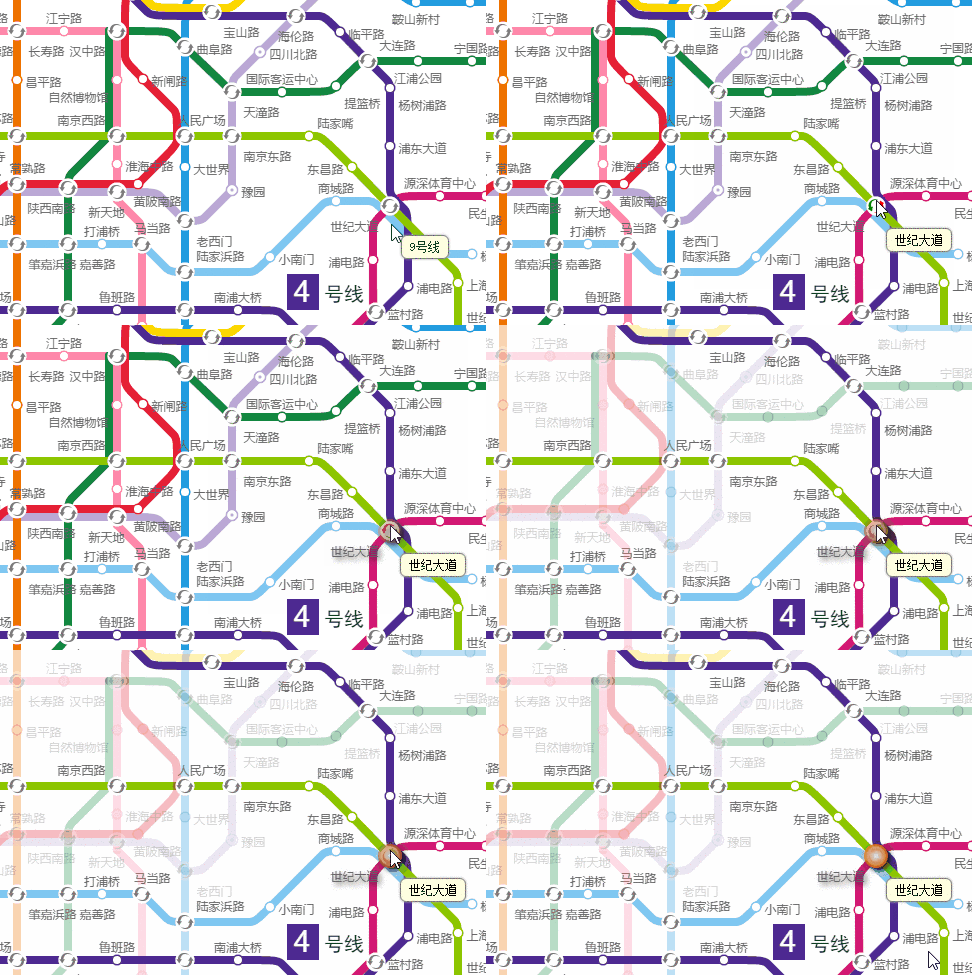
双击站点
双击站点,竟然弹出了本站周边的电子地图!知道引入他山之玉,看来小子可教啊。我发现他的定位方法,有的是用经纬度,有的是关键词查询。小弟狡黠地说,开始是人工查每个站点经纬度的,干了一段儿发现太麻烦,后来改路子了。马大大说的,懒人改变世界,我服!
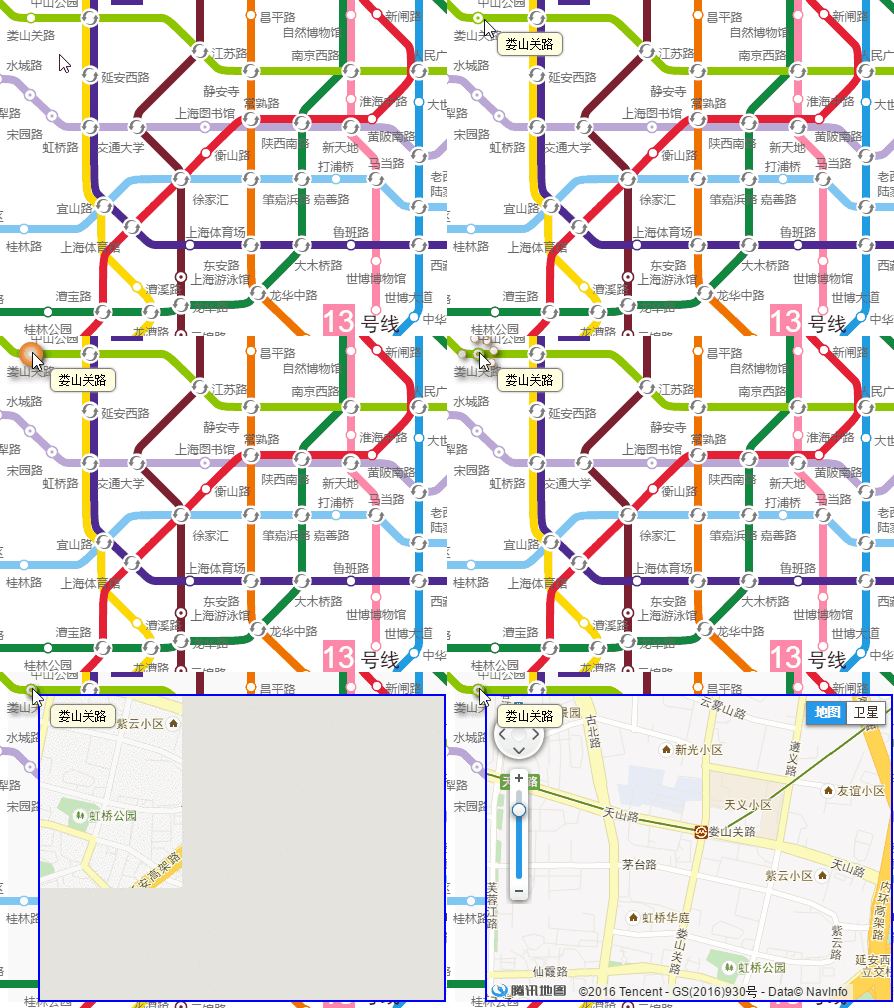
最后来八一八程序设计的思路吧,小弟是棵好苗子,能做出那么像样的程序,必然是深思熟虑过的。不想再听我啰嗦的朋友,也可以直接发邮件给我,tw-service@servasoft.com,来鉴赏下小弟的成果。
数据文件的整理
数据格式,选择了JavaScript原生支持的json文件,直观方便。数据结构,按照站点、线路、杂项三大块来组织,结构清晰,利于遍历、查询等操作。
1.    {
2.        "stations":{
3.            "l01s01":{ },
4.            …………
5.        }
6.        "lines":{
7.            "l01":{……},
8.            …………
9.        }
10.        "sundrys":{
11.            "railwaystationshanghai":{……},
12.            …………
13.        }
14. }命名比较规范,通过名字就可以看出基本信息(例如“l01s01”就是1号线第1个站点),甚至直接利用名字就可以进行查询和遍历。
1.    "l01s01":{
2.        "id":"l01s01",
3.        "name":"莘庄",
4.        "loc":{"x":419,"y":1330},
5.        "label":"bottomright.bottomright",
6.    },
7. …………站点路线的创建
首先是读取json文件的数据
1.    function loadJSON(path,callback){
2.        var xhr = new XMLHttpRequest();
3.        xhr.onreadystatechange = function(){
4.            if (xhr.readyState === 4) {
5.                if (xhr.status === 200) {
6.                   dataJson = JSON.parse(xhr.responseText);
7.                   callback && callback();
8.               }
9.           }
10.       };
11.       xhr.open("GET", path, true);
12.       xhr.send();
13. }因为读取文件是一个异步的过程,所以要程序的展开都要放在文件读取函数的内部。
1.    function init(){
2.        loadJSON("shanghaiMetro.json", function(){
3.            initNetwork(dataJson);
4.            initNode(dataJson);
5.        });
6. }只要通过对站点进行一次遍历,车站的建立就完成了。
1.    for(staId in json.stations){
2.        var station = json.stations[staId];
3.        staNode = new twaver.Node({
4.            id: staId,
5.            name: station.name,
6.            image:'station',
7.        });
8.        staNode.s('label.color','rgba(99,99,99,1)');
9.        staNode.s('label.font','12px 微软雅黑');
10.        staNode.s('label.position',station.label);
11.        staNode.setClient('location',station.loc);
12.        box.add(staNode);
13. }再对数据文件中的各条线路下的所有站点进行遍历,在站点间依次创建Link。
1.    for(lineId in json.lines) {
2.        ……
3.        for(staSn in line.stations) {
4.            ……
5.            var link = new twaver.Link(linkId,prevSta,staNode);
6.            link.s('link.color', line.color);
7.            link.s('link.width', linkWidth);
8.            link.setToolTip(line.name);
9.            box.add(link);
10.        }
11. }再对label位置进行调整,否则站点名称会显示的很乱。小弟是通过在原始数据中手动加入位置信息来实现的,稍显笨了一点,应该可以通过程序自动判断站点周围空间来进行智能调整。
最后再加入图标,一张原始的地铁图就呈现出来了。
路线拐点的添加
基本的示意功能已经具备了,这里,小弟让我很欣赏的一点是没有就此停止,而是进一步做了调整,使线路只保留了横平竖直和正斜的走向,以达到整齐美观的效果。可能看起来与参考图稍稍有些不同,主要因为各路段基本只添加了一个拐点,这样做既大大简化了程序,又基本保证了图形的美观度。想远一点,做多一点,是块做产品的好料子。
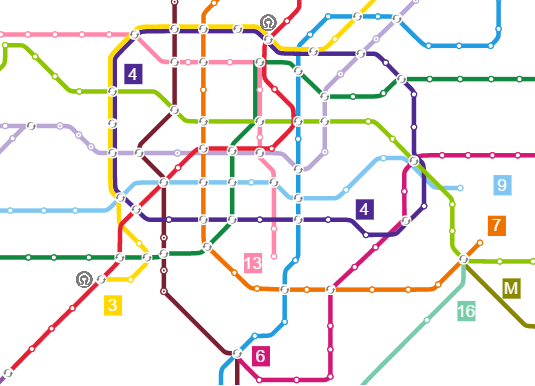
当然为了提高程序的灵活性,应对必须添加两个或以上拐点的情况,也使用了人工拐点的手段。不过这里人工拐点被设成一个隐形的节点,可能利于智能拐点的判断,但也有可能在路线操作时造成混乱。如何处理更好还可以进一步推敲。
var createTurnSta = function(line, staSn){
    staTurn = new twaver.Node(staSn);
    staTurn.setImage();
    staTurn.setClient('lineColor',line.color);
    staTurn.setClient('lines',[line.id]);
    var loc = line.stations[staSn];
    staTurn.setClient('location',loc);
    box.add(staTurn);
    return staTurn;
}接点位置的调整
大家可以看到,并不是所有路段都直接连入站点中心,在许多情况下必须要进行偏移。
var createFollowSta = function(json, line, staNode, staId){
    staFollow = new twaver.Follower(staId);
    staFollow.setImage();
    staFollow.setClient('lineColor',line.color);
    staFollow.setClient('lines',[line.id]);
    staFollow.setHost(staNode);
    var az = azimuth[staId.substr(6,2)];
    var loc0 = json.stations[staId.substr(0,6)].loc;
    var loc = {x:loc0.x+az.x, y:loc0.y+az.y};
    staFollow.setClient('location',loc);
    box.add(staFollow);
    return staFollow;
}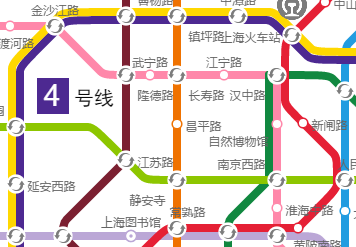
小弟采取了虚拟节点的办法,就是在站点的旁边,添加一个Follower(但并不显示出来),让并行的不同线路连接到不同的Follower上。通过调整Follower的位置,来实现线路与站点连接点的控制。
var azimuth = {
    bb: {x: 0, y: linkWidth*zoom/2},
    tt: {x: 0, y: -linkWidth*zoom/2},
    rr: {x: linkWidth*zoom/2, y: 0},
    ll: {x: -linkWidth/2, y: 0},
    br: {x: linkWidth*zoom*0.7/2, y: linkWidth*zoom*0.7/2},
    bl: {x: -linkWidth*zoom*0.7/2, y: linkWidth*zoom*0.7/2},
    tr: {x: linkWidth*zoom*0.7/2, y: -linkWidth*zoom*0.7/2},
    tl: {x: -linkWidth*zoom*0.7/2, y: -linkWidth*zoom*0.7/2},
    BB: {x: 0, y: linkWidth*zoom},
    TT: {x: 0, y: -linkWidth*zoom},
    RR: {x: linkWidth*zoom, y: 0},
    LL: {x: -linkWidth, y: 0},
    BR: {x: linkWidth*zoom*0.7, y: linkWidth*zoom*0.7},
    BL: {x: -linkWidth*zoom*0.7, y: linkWidth*zoom*0.7},
    TR: {x: linkWidth*zoom*0.7, y: -linkWidth*zoom*0.7},
    TL: {x: -linkWidth*zoom*0.7, y: -linkWidth*zoom*0.7}
};介绍到这里就结束了,虽然是个小例子,实在是但美观性和实用性都还过得去,小弟花了心思去做,其实稍加改造就可以做出高铁图、公交图、运行图等应用。设想一下,如果能用在轨道交通列控中心大屏监控里,是多么炫酷。
 What are the production methods of html5 animation production?
 The difference between HTML and HTML5
 Excel diagonal header is divided into two
 Introduction to the meaning of cloud download windows
 nozoomer
 Usage of fclose function
 How to center div in css
 Detailed explanation of nginx configuration
 exe virus solution


