
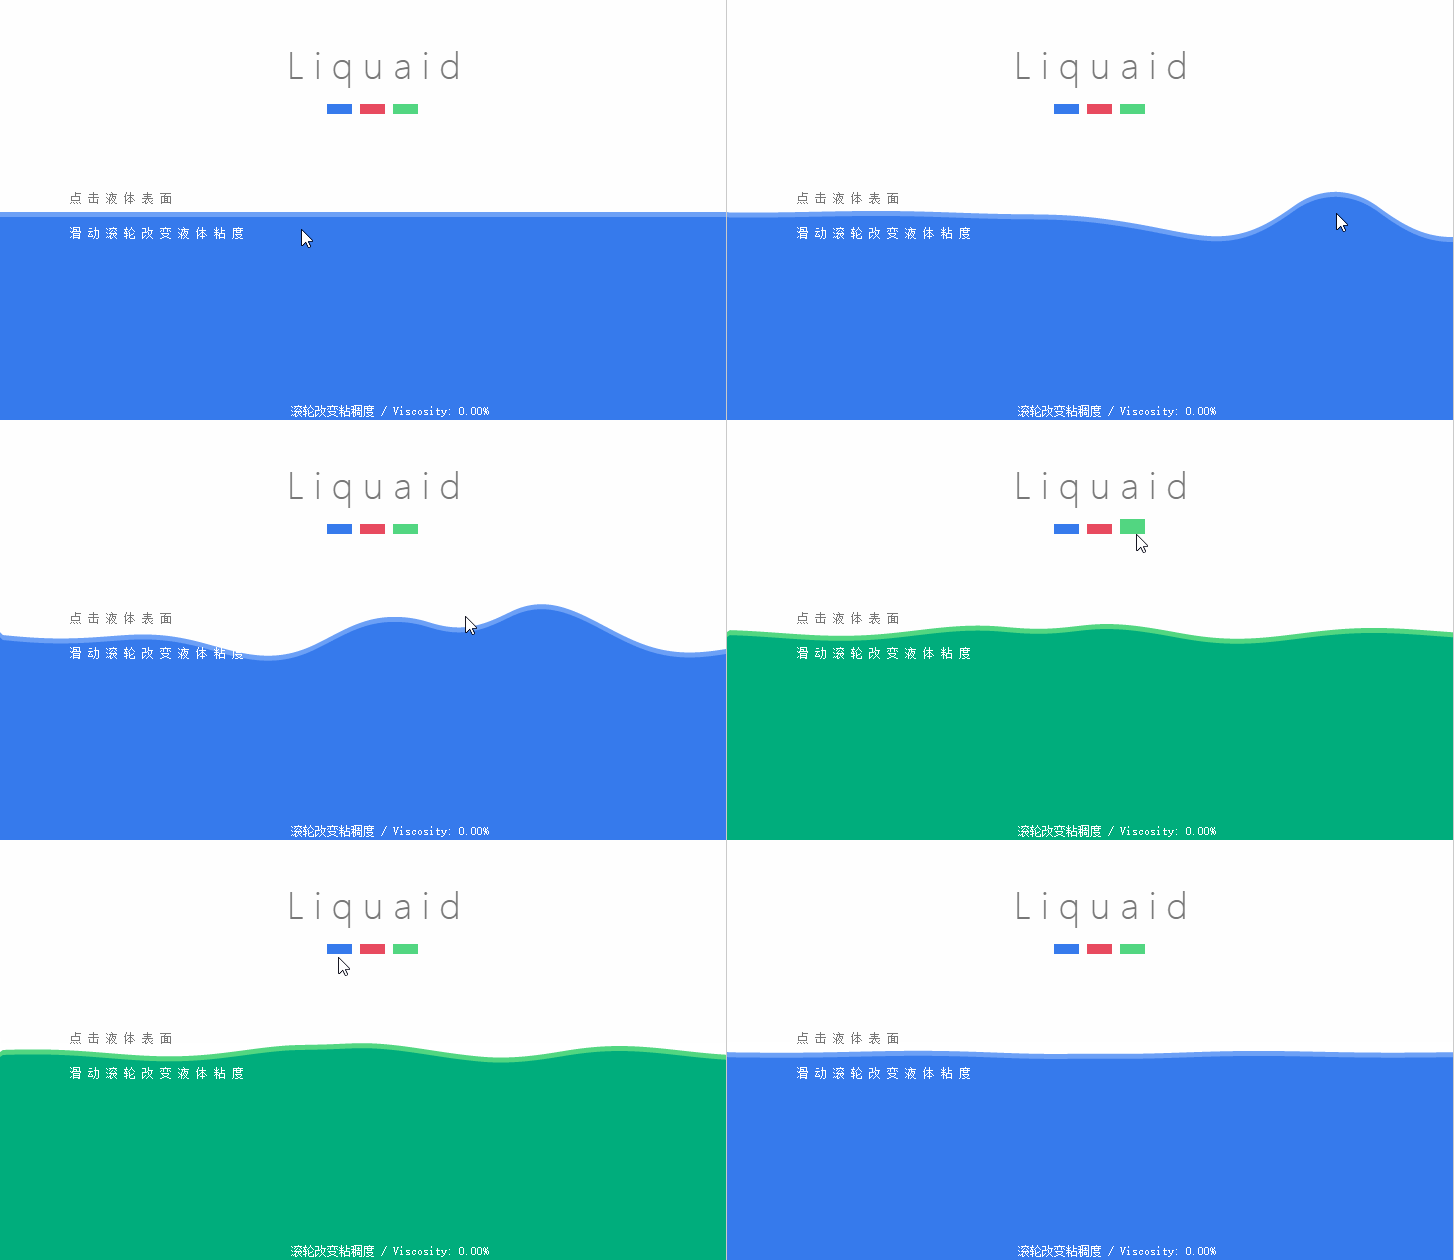
In this article we will analyze how this effect is achieved. If you are confused about the source code, I believe you will suddenly understand it after reading the analysis. First, the renderings:
1. Principle analysis
Compared with the simple water wave animation effect in the previous article, the animation effect in this article can not only interact with the mouse, but also the formation of the waves is more natural and more consistent. physical laws. The formation process of the entire animation is as shown in the animation. Click the mouse at the position of the liquid surface, and the liquid surface here will have a relatively large fluctuation, and then the vibration here will spread to both sides. With the energy Attenuation, the subsequent vibration amplitude will become lower and lower, and finally the energy will decay to zero, and the page will become calm. Doesn’t it sound very mysterious? It feels very profound! Chairman Mao told us not to be fooled by the surface phenomena of objects (who knows who said this o(^▽^)o). Below we will analyze the principles step by step.
First of all, in a static state we can see that the entire liquid surface is equivalent to a rectangle. And when we click on the position of the liquid surface, the rectangle changes accordingly. But in fact, not the entire rectangle has changed, but only the upper edge of the rectangle has changed. So how do you make only the top edge of the rectangle change? The secret is that the top edge of the rectangle is not simply lineTo() from the left point to the right point. Instead, it consists of many points lineTo(). It may not be easy to understand this way, let’s look at the picture to speak:
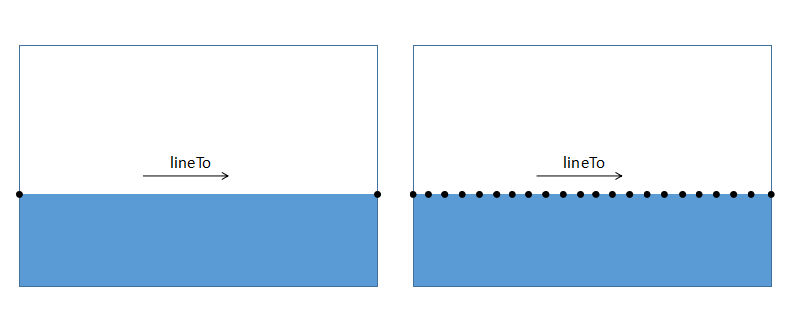
We have set a lot of points in the upper part. The ordinates of these points are the same, but they are separated by a certain distance in the horizontal direction. In this way, in a still state, we can see that it is no different from an ordinary rectangle. When we change the positions of these points, we can change the shape of the rectangle at the same time, thus creating different effects.
2. Differential Equation
Many people may have a headache when it comes to differential equations, but there is no method, just let it hurt! This knowledge point is in the section on differential equations in Advanced Mathematics. If you don’t understand it, forget it! It’s also good to remember the following usage, but for the sake of style, we will briefly introduce it.
In mathematics, a recurrence relation, also known as a difference equation, is an equation that defines a sequence recursively: each item in the sequence is defined as a function of the previous item. Some simply defined recurrence relations may exhibit very complex (chaotic) properties, and they belong to the field of nonlinear analysis in mathematics.
Remember, each item in the sequence is defined as a function of the previous item. This is the principle we use. If his image is drawn with matalab, it will look like this:
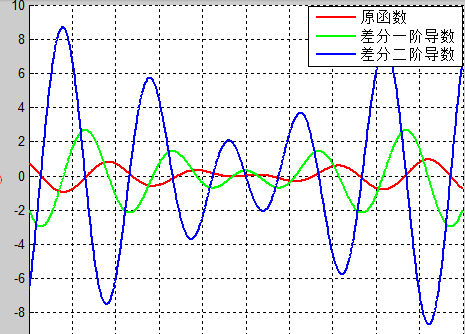
Just focus on the original function, the red curve is enough, does it look like a water wave? What we have to do is to arrange the bunch of points according to such a waveform.
3. Code implementation
1. Preparation
Now comes everyone’s favorite coding time. First, we create a point class Vertexes, whose function is to define and update a bunch of points. The code is in vertex.js, as follows:
function Vertex(x,y,baseY){
        this.baseY = baseY;         //基线
        this.x = x;                 //点的坐标
        this.y = y;
        this.vy = 0;                //竖直方向的速度
        this.targetY = 0;           //目标位置
        this.friction = 0.15;       //摩擦力
        this.deceleration = 0.95;   //减速
    }
//y坐标更新
Vertex.prototype.updateY = function(diffVal){
        this.targetY = diffVal + this.baseY;   //改变目标位置
        this.vy += (this.targetY - this.y);       //速度
        this.vy *= this.deceleration;
        this.y += this.vy * this.friction;     //改变坐标竖直方向的位置
}We are going to use this function to create a bunch of points. Back to our main file index.js. Let’s initialize some things we need to use first:
var canvas = document.getElementById('canvas'),
    ctx = canvas.getContext('2d'),
    W = window.innerWidth;
    H = window.innerHeight;

    canvas.width = W;
    canvas.height = H;

var color1 = "#6ca0f6",    //矩形1的颜色
    color2 = "#367aec";   //矩形2的颜色

var vertexes = [],    //顶点坐标
    verNum = 250,     //顶点数
diffPt = [], //差分值然后,创建点并把它push进vertexes中,同时也创建相应数量的差分值,同样把它放到diffPt数组中,这样每个点都有了对应的差分值。
for(var i=0; i<verNum; i++){
    vertexes[i] = new Vertex(W/(verNum-1)*i, H/2, H/2);
    diffPt[i] = 0;                                         //初始值都为0
}结果是,每个顶点的y坐标都在(H/2)的高度,水平坐标每隔一定的间隔取一个点。在这里是每隔4.5个像素取一个点,这与你canvas的宽度和点的数目有关。这样我们就把点创建完成了,来绘制一下看看效果。
代码如下:
function draw(){

        //矩形1
        ctx.save()
        ctx.fillStyle = color1;
        ctx.beginPath();
        ctx.moveTo(0, H);
        ctx.lineTo(vertexes[0].x, vertexes[0].y);
        for(var i=1; i<vertexes.length; i++){
            ctx.lineTo(vertexes[i].x, vertexes[i].y);
        }
        ctx.lineTo(W,H);
        ctx.lineTo(0,H);
        ctx.fill();
        ctx.restore();

        //矩形2
        ctx.save();
        ctx.fillStyle = color2;
        ctx.beginPath();
        ctx.moveTo(0, H);
        ctx.lineTo(vertexes[0].x, vertexes[0].y+5);
        for(var i=1; i<vertexes.length; i++){
            ctx.lineTo(vertexes[i].x, vertexes[i].y+5);
        }
        ctx.lineTo(W, H);
        ctx.lineTo(0, H);
        ctx.fill();
        ctx.restore();
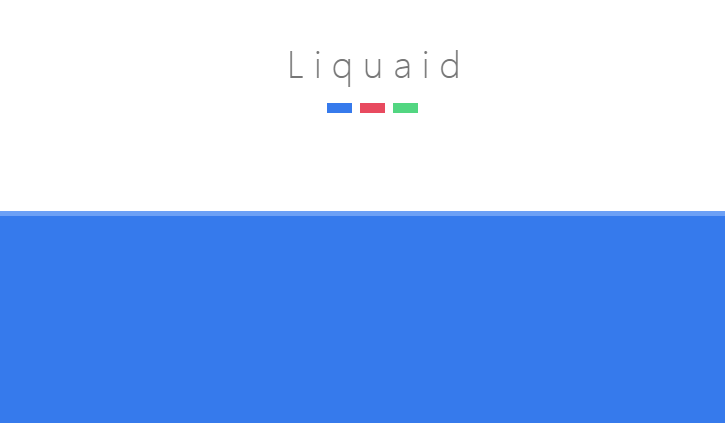
}就像你看到的那样此时我们的液面完全是静止的(因为没更新点嘛)。之所以要绘制两个矩形,你看看效果图就明白了,只是为了更好看,你完全可以绘制第三层,第四层。下面我们就来更新这些点的坐标。
2.核心代码
点的更新我们放在了update函数中。首先,我们设置一个初始的震荡点,缓冲变量和初始差分值。
var vPos = 125;  //震荡点
var dd = 15;     //缓冲
var autoDiff = 1000;  //初始差分值
这里的震荡点就是我们的起震位置,意思是vertexes中的第125号点开始起震,它对应的差分值就是autoDiff。它的改变会引起其他点的变化,从而达到更新其他差分值的效果。
function update(){
        autoDiff -= autoDiff*0.9;        //1
        diffPt[vPos] = autoDiff;

        //左侧
        for(var i=vPos-1; i>0; i--){     //2
            var d = vPos-i;
            if(d > dd){
                d=dd;
            }
            diffPt[i]-=(diffPt[i] - diffPt[i+1])*(1-0.01*d);
        }
        //右侧
        for(var i=vPos+1; i<verNum; i++){   //3
            var d = i-vPos;
            if(d>dd){
                d=dd;
            }
            diffPt[i] -= (diffPt[i] - diffPt[i-1])*(1-0.01*d);
        }

        //更新Y坐标
        for(var i=0; i<vertexes.length; i++){  //4
            vertexes[i].updateY(diffPt[i]);
        }
}现在我们对上面的部分做详细解释:
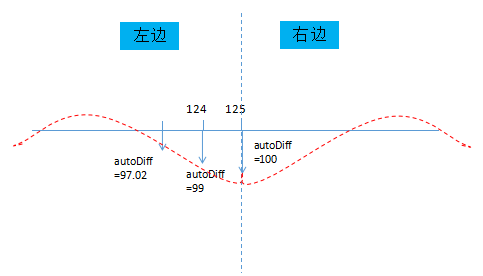
代码1: 我们设置了起震位置的差分偏移量为autoDiff=100,注意autoDiff -= autoDiff*0.9;, 也就是说它的值每一帧都会变化。
代码2:为起震位置的左边,主要关注diffPt[i]-=(diffPt[i] - diffPt[i+1])*(1-0.01*d);这一行。i的起始位置为124,默认差分值为0。稍作简单推算,你会发现,经过更新后第124号点的差分值为99,同理第123号为97.02。以此类推,我们就可以得到第一帧的所有点的差分值。右边同理。
代码4:在得到第一帧的差分值后就该调用每个点的更新函数了,并且传入计算好的差分值。形成的效果如下图所示
看一下updateY函数,我们把目标位置targetY设置为差分值diffVal和基线baseY的和。然后,通过距离计算需要运动的速度vy,最后将速度作用于点的纵坐标。这一段是不是与弹性动画缓动动画那一节很相似呢?
在缓冲系数dd的作用下,两侧的波会在扩散的过程中越来越小,最后趋近于0.我们也是通过这个变量去控制液体的粘度系数,达到粘稠度高的物体扩散的越缓慢并且起伏比较低,粘稠度低的物体扩散迅速但起伏大的效果。
随后,因为autoDiff的不断衰减,不同幅值波形的叠加形成波浪效果,最终衰减到0.液面也就趋于平静了。
现在,我们把update()和draw()放入动画循环中你就会看到水波起伏然后趋于平静的效果。
(function drawframe(){
        ctx.clearRect(0, 0, W, H);
        window.requestAnimationFrame(drawframe, canvas);
        update()
        draw();
})()3.鼠标交互
上面的代码已经实现了波浪动画的效果,但是震荡完成后就平静了,不会再发生震荡的效果。这一步我们就来实现点哪,哪震的效果。实现的思路很简单:水波之所以区域平静是因为起震位置的差分值不断衰减的结果,我们只需要在点击鼠标的位置重设autoDiff就可以了。此外,起震点的位置也要变成鼠标点击的位置。代码如下:
canvas.addEventListener('mousedown', function(e){
        var mouse = {x:null, y:null};

        if(e.pageX||e.pageY){
            mouse.x = e.pageX;
            mouse.y = e.pageY;
        }else{
            mouse.x = e.clientX + document.body.scrollLeft +document.documentElement.scrollLeft;
            mouse.y = e.clientY + document.body.scrollTop +document.documentElement.scrollTop;
        }

        //重设差分值
        if(mouse.y>(H/2-50) && mouse.y<(H/2 +50)){
            autoDiff = 1000;
            vPos = 1 + Math.floor((verNum - 2) * mouse.x / W);
            diffPt[vPos] = autoDiff;
        }

        console.log(mouse.x, mouse.y)

}, false)在获取鼠标位置这里应该注意一点,我们没有减去canvas的偏移量,这是因为在这里canvas做的是全屏设置。所以,如果你的画布并不是全屏大小,建议你使用我们的utils.js文件中的方法captureMouse来获取鼠标的坐标。
另外在判断鼠标是否点击在了液面上,我们设定了一个比较宽的范围,上下共100px。这样做的目的是让用户很容易就能触发这个事件,而不是只在页面那唯一的一个值上才能触发。这种做法相信你以前做过,对于比较小的物体我们会遮罩一个大一些的透明物体,然后在该物体上做事件的触发,便于用户操作。


