Hi, this is a canvas that imitates Alipay’s Zhima Credit Score. It is actually an animated dashboard.
First of all, the original picture above:

This is a screenshot on Alipay. The low score makes you laugh. Then take a look at the renderings I achieved using canvas:
<canvas id="canvas" width="400" height="700" data-score='724'></canvas> <!-- 设置data-score,分数区间[400, 900] -->

Alas, it doesn’t feel like it. This is a GIF image, and the effect may be better when opened on a web page (of course that may be the case). You can click on the bottom to preview the demo on codepen. There are two imperfections. One is that the scale on the Sesame Credit dial is actually uneven. I used the same scale for simple implementation; the other is that the moving points on the dial have a blurry effect. Not solved. Oh, let’s talk about it next time.
Next, let’s talk about how to achieve it. The first step, international practice, is to create a canvas:
var canvas = document.getElementById('canvas'),
    ctx = canvas.getContext('2d'),
    cWidth = canvas.width,
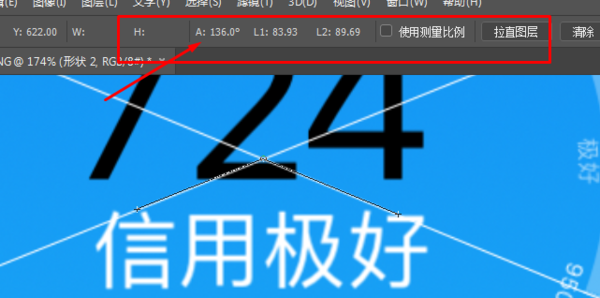
cHeight = canvas.height;Then draw the dial. Although it is not a Virgo, it should be as consistent as possible with the original picture. That is, what is the angle of this annular opening? Please go to PS to measure it:

Well, 136°, this angle is really tricky. To facilitate the subsequent calculation, it is approximately equal to 140°. Then the arc of a fractional segment is:
var deg1 = Math.PI * 11 / 45
First draw the semi-transparent scale layer in the middle:
ctx.save(); //中间刻度层
ctx.beginPath();
ctx.strokeStyle = 'rgba(255, 255, 255, .2)';
ctx.lineWidth = 10;
ctx.arc(0, 0, 135, 0, 11 * deg0, false);
ctx.stroke();
ctx.restore();
Then, draw 6 scale lines and use a for loop to implement:
ctx.save(); // 刻度线
for (var i = 0; i < 6; i++) {
ctx.beginPath();
ctx.lineWidth = 2;
ctx.strokeStyle = 'rgba(255, 255, 255, .3)';
ctx.moveTo(140, 0);
ctx.lineTo(130, 0);
ctx.stroke();
ctx.rotate(deg1);
}
ctx.restore();Similarly, then draw the large scale finely Divided into 5 small scales:
ctx.save(); // 细分刻度线
for (i = 0; i < 25; i++) {
if (i % 5 !== 0){
ctx.beginPath();
ctx.lineWidth = 2;
ctx.strokeStyle = 'rgba(255, 255, 255, .1)';
ctx.moveTo(140, 0);
ctx.lineTo(133, 0);
ctx.stroke();
}
ctx.rotate(deg1 / 5);
}
ctx.restore();The scale is ok here. You also need to mark the scale with text and the credit level of each fraction. Please refer to the code for details, because it is similar to the principle of scale implementation, so I won’t go into details. . The most important thing now is to realize the moving point on the dial (I don’t know how to call it, so I will call it the moving point below). We can think of it this way, it is a circle with a very small radius, which is just a circle drawn on the outermost ring track. , and the method of realizing the circle on the canvas is:
ctx.arc(x, y, radius, sAngle, eAngle, false);
We only need to control x and y to make it move and achieve the effect we want. So, create a moving point object:
function Dot() {
  this.x = 0;
  this.y = 0;
  this.draw = function (ctx) {
    ctx.save();
    ctx.beginPath();
    ctx.fillStyle = 'rgba(255, 255, 255, .7)';
    ctx.arc(this.x, this.y, 3, 0, Math.PI * 2, false);
    ctx.fill();
    ctx.restore();
  };
}
var dot = new Dot(),
    dotSpeed = 0.03, //控制动点的速度
    angle = 0, //这个很关键,用来得到动点的坐标x, y
credit = 400; //信用最低分数How to get the coordinates x, y of dot? Then we have to use the legendary trigonometric functions.

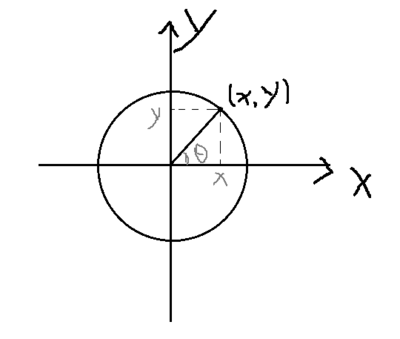
From the above picture we can get
x = r * cos(angle), y = r * sin(angle)
In JavaScript, the center coordinate of dot becomes:
dot.x = radius * Math.cos(angle); //radius为最外层轨道的半径值
dot.y = radius * Math.sin(angle);
Next we only need to get this angle. This can be obtained through the proportional relationship between radian and score:
var aim = (score - 400) * deg1 / 100;
if (angle < aim) {
  angle += dotSpeed;
}
dot.draw(ctx);Then let the middle credit score change with the rotation of the moving point, create a text(), in order to make the numerical changes consistent with the moving point, according to Calculate the digital change at the rate of moving points:
function text(process) {
  ctx.save();
  ctx.rotate(10 * deg0);
  ctx.fillStyle = '#000';
  ctx.font = '80px Microsoft yahei';
  ctx.textAlign = 'center';
  ctx.textBaseLine = 'top';
  ctx.fillText(process, 0 ,10);
  ctx.restore();
}
var textSpeed = Math.round(dotSpeed * 100 / deg1),
if (credit < score - textSpeed) {
  credit += textSpeed;
} else if (credit >= score - textSpeed && credit < score) {
  credit += 1; // 这里确保信用分数最后停下来是我们输入的分数
}
text(credit);In the end, all this cannot escape letting window.requestAnimationFrame() control the drawing animation and ctx.clearRect(0, 0, cWidth, cHeight) to clear the canvas.
If it’s not well written, everyone will just have to deal with it. I believe everyone’s ability to understand the code must be better than understanding my words that I don’t even know what to say.


