JVM memory management
It is said that C is awesome. That’s because C solves problems entirely by the programmers themselves. They know exactly what their program looks like in the memory. As for Java, you don’t need to have too much knowledge about the operating system, and you don’t need to pay attention to memory issues all the time, but this does not mean that we don’t need to understand the principles behind it (in fact, I was ridiculed by the company’s C OoO). The reason why Java is easy to get started is because the most difficult problems have been solved by predecessors, and all this is due to the Java Virtual Machine. The JVM is actually an abstract computer with its own instruction set. It has its own machine language and its own memory management. This series will reveal its true identity one by one.
This article is based on the Java HotSpot™ virtual machine, JDK 1.8, and will discuss:
JVM internal structure
JVM memory management
JVM memory model

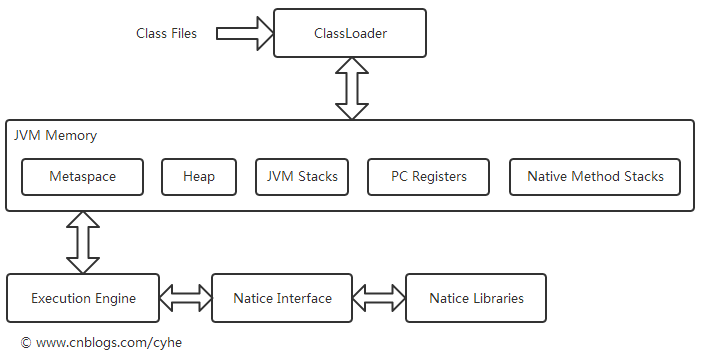
Figure 1 JVM internal structure
1. JVM internal structure
The process of executing a program is like this. Taking C language as an example, the source code is first compiled into an executable file and stored on the disk in binary form. When executed, it is first loaded from the disk into the memory, and then the processor Start executing the machine instructions in the target program. In contrast, Java is first compiled into a bytecode file, which has nothing to do with the platform. The JVM is loaded into the memory through the ClassLoader and then executes the machine instructions. The JVM helps us deal with the operating system. With bytecode and JVM, Java achieves platform independence. JVM can also be considered as a process. It applies for a piece of memory when it starts, and then divides the memory into the following different areas according to different functions:
(1) Heap
Heap, a very important area, is shared by all threads. Basically all object instances are allocated here, and most garbage collection occurs here. This part of memory is managed by the JVM using the Garbage Collector (automatic memory management tool). Its responsibility is to allocate memory for objects and release free memory. The size of the Java heap can be controlled using parameters to determine whether it is fixed or dynamically expanded.
(2) JVM Stacks
The stack is closely related to the thread. It is private to the thread. It lives and dies with the thread. It is the memory where the thread performs work. The Java stack and the local method stack in HotSpot are combined into one, and both are allocated in the local memory space. This part of the memory does not need to be deliberately managed by the JVM. The JVM stack is mainly used to store stack frames. When a method is called, a stack frame is created and destroyed when the method is completed. From the perspective of the stack, there are two operations: push and pop.
The stack frame is a data structure used to store local variables, operand stacks, and references to the current class’s runtime constant pool. Local variable array: used to save the basic type variables defined in the method. The subscript starts from 0. The JVM uses the local variable table to pass the method parameters. When an instance method is called, the 0th position stores the this reference of the current object; the operand Stack: used to perform operations and prepare parameters for calling methods and return results of methods; dynamic link: runtime constant pool of reference objects.
(3) PC Register
Program counter, thread private, main function is to store instruction address, fetch, decode and execute. Each thread is associated with unique stack and PC registers.
(4) Metaspace
Metaspace, which HotSpot VM before JDK8 called the method area or permanent generation, is shared by each thread. It stores the structural information of a class, such as constant pool, fields, methods, etc. Stored in local memory, not related to the heap.
(5) Native Method Stacks
The JVM stack is prepared for Java methods, and the local method stack serves the virtual machine to call local methods.
2. JVM memory management
Java does not allow direct manipulation of memory, and the application and release of memory are handled by the virtual machine.
2.1 Garbage Collection Automatic Memory Management
Responsibilities of automatic memory management (hereinafter referred to as GC):
Allocate memory
Ensure that reference objects remain in memory
Recycle the memory of unreachable reference objects
GC solves most of the problems Memory allocation problem itself also occupies certain resources. Garbage collection is triggered when the heap is full or when one of its components reaches a threshold. Garbage collection mainly considers the following aspects: the frequency and time of recycling. For example, if the heap is small, the number of recycling times is more. If the heap is large, the number of recycling times is fewer, but the time for recycling is long; memory fragmentation problem; garbage collection under multi-threaded programs.
Garbage collection strategy:
(1) Serial versus Parallel
Serial, only one garbage collection thread can work at the same time; parallel, in a multi-CPU system, multiple garbage collection threads can work at the same time.
(2) Concurrent versus Stop-the-world (Concurrent versus Stop-the-world)
Stop-the-world garbage collector, during the recycling period, the application completely suspends its work, and the heap is equivalent to being frozen. , the state of the object is immutable; concurrently, one or more garbage collection tasks are executed at the same time as the application, there may be a short Stop-the-world, and the state of the object may change during collection.
(3) Copying
Divide the memory into two halves. When recycling, copy the surviving objects to the other half of the space, and then clear the current memory. Subsequent memory allocation is easier, but the memory utilization is relatively low.
(4) Compacting versus Non-compacting
Mark clearing, marking recyclable objects, and recycling them uniformly. Without memory compression, a large number of memory fragments will be generated. When allocating large objects, It may be impossible to find contiguous memory; marking and sorting, after marking, the memory is first compressed and sorted, and all surviving objects are put together for recycling.
(5) Generational collection
Divide the heap into several areas, the new generation and the old generation. Different areas use different recycling methods above.
2.2 Generational collection in HotSpot
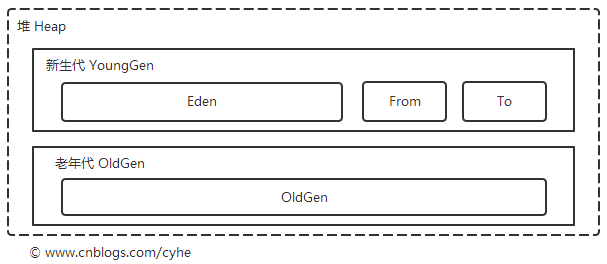
In HotSpot, the memory is divided into the new generation and the old generation. The new generation is divided into Eden and two Survivor spaces of the same size. Most objects are allocated in Eden, and some large objects are allocated in Eden. May be allocated directly to the old generation.
The structure of the heap is as follows:

Figure 2 Heap

Hot AI Tools

Undresser.AI Undress
AI-powered app for creating realistic nude photos

AI Clothes Remover
Online AI tool for removing clothes from photos.

Undress AI Tool
Undress images for free

Clothoff.io
AI clothes remover

Video Face Swap
Swap faces in any video effortlessly with our completely free AI face swap tool!

Hot Article

Hot Tools

Notepad++7.3.1
Easy-to-use and free code editor

SublimeText3 Chinese version
Chinese version, very easy to use

Zend Studio 13.0.1
Powerful PHP integrated development environment

Dreamweaver CS6
Visual web development tools

SublimeText3 Mac version
God-level code editing software (SublimeText3)

Hot Topics
 1389
1389
 52
52
 How to elegantly obtain entity class variable names to build database query conditions?
Apr 19, 2025 pm 11:42 PM
When using MyBatis-Plus or other ORM frameworks for database operations, it is often necessary to construct query conditions based on the attribute name of the entity class. If you manually every time...
 How to simplify field mapping issues in system docking using MapStruct?
Apr 19, 2025 pm 06:21 PM
Field mapping processing in system docking often encounters a difficult problem when performing system docking: how to effectively map the interface fields of system A...
 How does IntelliJ IDEA identify the port number of a Spring Boot project without outputting a log?
Apr 19, 2025 pm 11:45 PM
Start Spring using IntelliJIDEAUltimate version...
 Is the company's security software causing the application to fail to run? How to troubleshoot and solve it?
Apr 19, 2025 pm 04:51 PM
Troubleshooting and solutions to the company's security software that causes some applications to not function properly. Many companies will deploy security software in order to ensure internal network security. ...
 What is the difference between memory leaks in Java programs on ARM and x86 architecture CPUs?
Apr 19, 2025 pm 11:18 PM
Analysis of memory leak phenomenon of Java programs on different architecture CPUs. This article will discuss a case where a Java program exhibits different memory behaviors on ARM and x86 architecture CPUs...
 How to safely convert Java objects to arrays?
Apr 19, 2025 pm 11:33 PM
Conversion of Java Objects and Arrays: In-depth discussion of the risks and correct methods of cast type conversion Many Java beginners will encounter the conversion of an object into an array...
 How to convert names to numbers to implement sorting within groups?
Apr 19, 2025 pm 01:57 PM
How to convert names to numbers to implement sorting within groups? When sorting users in groups, it is often necessary to convert the user's name into numbers so that it can be different...
 How do I convert names to numbers to implement sorting and maintain consistency in groups?
Apr 19, 2025 pm 11:30 PM
Solutions to convert names to numbers to implement sorting In many application scenarios, users may need to sort in groups, especially in one...


