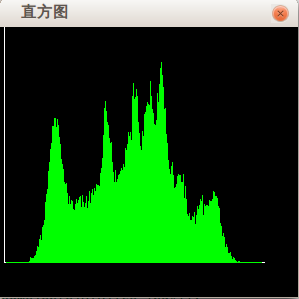
In the previous article, we have already talked about the grayscale of the image. After grayscale, we hope to understand the distribution of pixels between 0-255. This is the grayscale histogram of the image we are going to talk about below, which is the simplest one. But the principles are the same. The histogram of an image has a lot of uses. It reflects certain characteristics of the image and can be used for image search.
The code to obtain the histogram information is as follows:
public int[] hist(){
        toGray();
        int[] hist = new int[256];
        int len = h*w;

        for(int i=0;i<len;i++)
            hist[data[i]]++;
        return hist;
}Then what we have to do is to draw the statistical histogram of the image, the code is as follows:
public BufferedImage getHist(){
	toGray();
	int[] intensity = hist();
	int size = 300;
	BufferedImage pic = new BufferedImage(size,size, BufferedImage.TYPE_4BYTE_ABGR);
	Graphics2D g2d = pic.createGraphics();
        g2d.setPaint(Color.BLACK);
        g2d.fillRect(0, 0, size, size);
        g2d.setPaint(Color.WHITE);
        g2d.drawLine(5, 250, 265, 250);
        g2d.drawLine(5, 250, 5, 5);

        g2d.setPaint(Color.GREEN);
        int max = math.findMaxValue(intensity);  //找到直方图中最大的值
        float rate = 200.0f/((float)max);
        int offset = 2;
        for(int i=0; i<intensity.length; i++) {
            int frequency = (int)(intensity[i] * rate);
            g2d.drawLine(5 + offset + i, 250, 5 + offset + i, 250-frequency);
        }

        g2d.setPaint(Color.RED);
        g2d.drawString("", 100, 270);
        return pic;
}The above code refers to Image Analysis The histogram analysis
The running results are as follows:


