1. Commands to display information
<!DOCTYPE html> <html> <head> <title>常用console命令</title> <meta http-equiv="Content-Type" content="text/html; charset=utf-8" /> </head> <body> <script type="text/javascript"> console.log('hello'); console.info('信息'); console.error('错误'); console.warn('警告'); </script> </body> </html>
The most commonly used one is console.log.
2. Placeholder
console The above concentration supports the placeholder format of printf. The supported placeholders are: characters (%s), integers (%d or %i ), floating point number (%f) and object (%o)
<script type="text/javascript">
   console.log("%d年%d月%d日",2011,3,26);
</script>Effect:

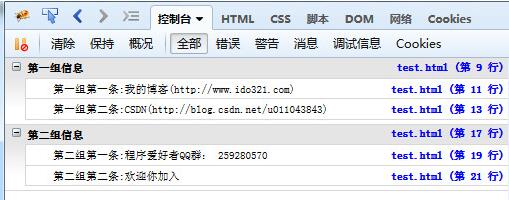
3. Information Grouping
<!DOCTYPE html>
 <html>
 <head>
  <title>常用console命令</title>
  <meta http-equiv="Content-Type" content="text/html; charset=utf-8" />
 </head>
 <body>
  <script type="text/javascript">
   console.group("第一组信息");

      console.log("第一组第一条:我的博客(http://www.ido321.com)");

      console.log("第一组第二条:CSDN(http://blog.csdn.net/u011043843)");

    console.groupEnd();

    console.group("第二组信息");

      console.log("第二组第一条");

     console.log("第二组第二条:欢迎你加入");

    console.groupEnd();  </script>
 </body>
</html>Effect:

4. View object information
console.dir( ) can display all properties and methods of an object.
<script type="text/javascript">
   var info = {
    blog:"http://www.ido321.com",
    QQGroup:259280570,
    message:"程序爱好者欢迎你的加入"
   };   console.dir(info);
</script>Effect:

5. Display the content of a certain node
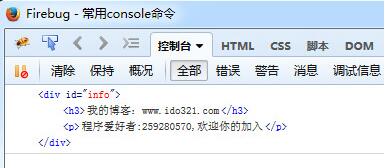
console.dirxml() is used to display a certain part of the web page The html/xml code contained in the node.
<!DOCTYPE html> <html> <head> <title>常用console命令</title> <meta http-equiv="Content-Type" content="text/html; charset=utf-8" /> </head> <body> <div id="info"> <h3>我的博客:www.ido321.com</h3> <p>程序爱好者:259280570,欢迎你的加入</p> </div> <script type="text/javascript"> var info = document.getElementById('info'); console.dirxml(info); </script> </body> </html>
Effect:

6. Determine whether the variable is true
console.assert() is used to determine an expression or variable Is it true. If the result is no, a corresponding message is output to the console and an exception is thrown.
<script type="text/javascript">
   var result = 1;
   console.assert( result );
   var year = 2014;
   console.assert(year == 2018 );
</script>
1 is a non-0 value, which is true; while the second judgment is false, an error message is displayed on the console

7. Tracking function calls Trace
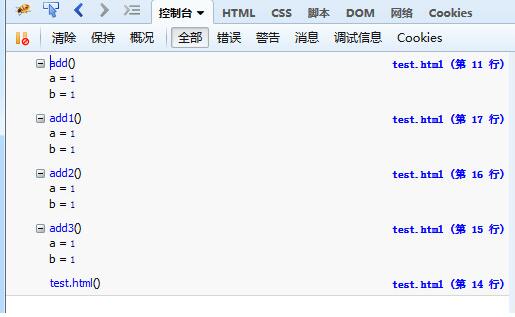
console.trace() is used to trace the function call trace.
<script type="text/javascript">
 /*函数是如何被调用的,在其中加入console.trace()方法就可以了*/
 function add(a,b){
 console.trace();
     return a+b;
  }
  var x = add3(1,1);
  function add3(a,b){return add2(a,b);}
  function add2(a,b){return add1(a,b);}
  function add1(a,b){return add(a,b);}
</script>Console output information:

8. Timing function
console.time() and console.timeEnd(), use to show the running time of the code.
<script type="text/javascript">
   console.time("控制台计时器一");
   for(var i=0;i<1000;i++){
     for(var j=0;j<1000;j++){}
   }
   console.timeEnd("控制台计时器一");
</script>The running time is 38.84ms

9. Performance analysis of console.profile()
Performance analysis (Profiler) is analysis The running time of each part of the program to find out where the bottleneck is, the method used is console.profile().
<script type="text/javascript">
function All(){
alert(11);
for(var i=0;i<10;i++){
funcA(1000);
}
funcB(10000);
}
function funcA(count){
for(var i=0;i<count;i++){}
}
function funcB(count){
for(var i=0;i<count;i++){}
}
console.profile('性能分析器');
All();
console.profileEnd();
</script>The output is as shown in the figure:

The above is the entire content of this article. I hope it will be helpful to everyone's learning. I also hope that everyone will support the PHP Chinese website. .
For more related articles on 9 Console commands that make JavaScript debugging easier, please pay attention to the PHP Chinese website!
 How to restore Bluetooth headset to binaural mode
 What browser is edge?
 Win10 does not support the disk layout solution of Uefi firmware
 How to use dict function in Python
 What are the differences between hibernate and mybatis
 What should I do if iis cannot start?
 what does bbs mean
 Advantages and Disadvantages of Free Overseas Website Servers


