Self-study C#08 from 0--Drawing curve chart control
Use of chart control
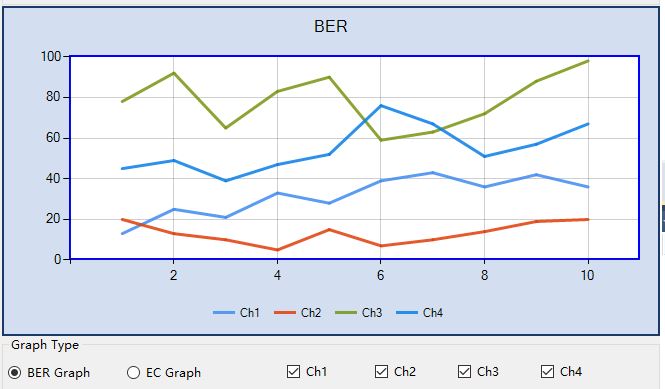
This article introduces how to use the chart control in the toolbox to draw multiple curves. The rendering is as follows:

1.InitializeChart
Add the chart control to the form, and then clear the ChartAreas, Legends and Series collections in the properties. They will Dynamically implemented by the following code. In the form constructor, implement the InitializeChart and DrawSeries methods.
InitializeChart code is as follows.
public partial class MainFormBERT : Form
    {
        public MainFormBERT()
        {
            InitializeComponent();
            InitializeChart();
            DrawSeries();
        }

         public void InitializeChart()
        {            #region 设置图表的属性
            //图表的背景色
            chart1.BackColor = Color.FromArgb(211, 223, 240);
            //图表背景色的渐变方式
            chart1.BackGradientStyle = GradientStyle.None;
            //图表的边框颜色、
            chart1.BorderlineColor = Color.FromArgb(26, 59, 105);
            //图表的边框线条样式
            chart1.BorderlineDashStyle = ChartDashStyle.Solid;
            //图表边框线条的宽度
            chart1.BorderlineWidth = 2;
            //图表边框的皮肤
            chart1.BorderSkin.SkinStyle = BorderSkinStyle.None;
            #endregion

            #region 设置图表的Title
            Title title = new Title();
            //标题内容
            title.Text = "BER";
            //标题的字体
            title.Font = new System.Drawing.Font("Microsoft Sans Serif", 12, FontStyle.Regular);
            //标题字体颜色
            //title.ForeColor = Color.FromArgb(26, 59, 105);
            //标题阴影颜色
            //title.ShadowColor = Color.FromArgb(32, 0, 0, 0);
            //标题阴影偏移量
            //title.ShadowOffset = 3;

            chart1.Titles.Add(title);
            #endregion

            #region 设置图表区属性
            //图表区的名字
            ChartArea chartArea = new ChartArea("Default");
            //背景色
            chartArea.BackColor = Color.White;// Color.FromArgb(64, 165, 191, 228);
            //背景渐变方式
            chartArea.BackGradientStyle = GradientStyle.None;
            //渐变和阴影的辅助背景色
            chartArea.BackSecondaryColor = Color.White;
            //边框颜色
            chartArea.BorderColor = Color.Blue;
            //边框线条宽度
            chartArea.BorderWidth = 2;
            //边框线条样式
            chartArea.BorderDashStyle = ChartDashStyle.Solid;
            //阴影颜色
            //chartArea.ShadowColor = Color.Transparent;

            //设置X轴和Y轴线条的颜色和宽度
            chartArea.AxisX.LineColor = Color.FromArgb(64, 64, 64, 64);
            chartArea.AxisX.LineWidth = 1;
            chartArea.AxisY.LineColor = Color.FromArgb(64, 64, 64, 64);
            chartArea.AxisY.LineWidth = 1;

            //设置X轴和Y轴的标题
            //chartArea.AxisX.Title = "time";
            //chartArea.AxisY.Title = "count";
            //chartArea.AxisX.TitleFont = new System.Drawing.Font("Microsoft Sans Serif", 10, FontStyle.Regular);
            //chartArea.AxisY.TitleFont = new System.Drawing.Font("Microsoft Sans Serif", 10, FontStyle.Regular);

            //设置图表区网格横纵线条的颜色和宽度
            chartArea.AxisX.MajorGrid.LineColor = Color.FromArgb(64, 64, 64, 64);
            chartArea.AxisX.MajorGrid.LineWidth = 1;
            chartArea.AxisY.MajorGrid.LineColor = Color.FromArgb(64, 64, 64, 64);
            chartArea.AxisY.MajorGrid.LineWidth = 1;

            chart1.ChartAreas.Add(chartArea);
            #endregion

            #region 图例及图例的位置
            Legend legend = new Legend();
            legend.Alignment = StringAlignment.Center;
            legend.Docking = Docking.Bottom;
            legend.BackColor = Color.Transparent;

            this.chart1.Legends.Add(legend);
            #endregion
        }
}2. Set the curve style
Type, color and width, etc.
private Series SetSeriesStyle(int i)
        {
            Series series = new Series(string.Format("Ch{0}", i + 1));            //Series的类型
            series.ChartType = SeriesChartType.Line;            //Series的边框颜色
            series.BorderColor = Color.FromArgb(180, 26, 59, 105);            //线条宽度
            series.BorderWidth = 3;            //线条阴影颜色
            //series.ShadowColor = Color.Black;
            //阴影宽度
            //series.ShadowOffset = 2;
            //是否显示数据说明
            series.IsVisibleInLegend = true;            //线条上数据点上是否有数据显示
            series.IsValueShownAsLabel = false;            //线条上的数据点标志类型
            series.MarkerStyle = MarkerStyle.None;            //线条数据点的大小
            //series.MarkerSize = 8;
            //线条颜色
            switch (i)
            {                case 0:
                    series.Color = Color.FromArgb(220, 65, 140, 240);                    break;                case 1:
                    series.Color = Color.FromArgb(220, 224, 64, 10);                    break;                case 2:
                    series.Color = Color.FromArgb(220, 120, 150, 20);                    break;                case 3:
                    series.Color = Color.FromArgb(220, 12, 128, 232);                    break;
            }            return series;
}3. Draw the curve
Get the data from the datatable and draw four curves .
//绘制曲线
     private void DrawSeries()
        {
            dt = new TestDataTable();
            dt.CreateTable();            for (int i = 0; i < 4; i++)
            {
                Series series = this.SetSeriesStyle(i);
                DataRow[] foundRows;                string expression = "Ch = " + i;
                foundRows = dt.Select(expression);                foreach (DataRow row in foundRows)
                {
                    series.Points.AddXY(row[0], row[2]);
                }                this.chart1.Series.Add(series);
            }
}4. Show or hide curves
Show and hide these four curves according to the status of the checkbox.
//显示隐藏曲线
     private void DisOrPlaySeries(int i)
        {            if (checkBox[i].Checked)
            {
                DataRow[] foundRows;                string expression = "Ch = " + i;
                foundRows = dt.Select(expression);                foreach (DataRow row in foundRows)
                {                    this.chart1.Series[i].Points.AddXY(row[0], row[2]);
                }
            }            else
            {                this.chart1.Series[i].Points.Clear();
            }
}The above is the content of self-study C#08 from 0--drawing curve chart control. For more related content, please pay attention to the PHP Chinese website (www.php.cn)!

Hot AI Tools

Undresser.AI Undress
AI-powered app for creating realistic nude photos

AI Clothes Remover
Online AI tool for removing clothes from photos.

Undress AI Tool
Undress images for free

Clothoff.io
AI clothes remover

AI Hentai Generator
Generate AI Hentai for free.

Hot Article

Hot Tools

Notepad++7.3.1
Easy-to-use and free code editor

SublimeText3 Chinese version
Chinese version, very easy to use

Zend Studio 13.0.1
Powerful PHP integrated development environment

Dreamweaver CS6
Visual web development tools

SublimeText3 Mac version
God-level code editing software (SublimeText3)

Hot Topics
 Active Directory with C#
Sep 03, 2024 pm 03:33 PM
Guide to Active Directory with C#. Here we discuss the introduction and how Active Directory works in C# along with the syntax and example.
 Random Number Generator in C#
Sep 03, 2024 pm 03:34 PM
Guide to Random Number Generator in C#. Here we discuss how Random Number Generator work, concept of pseudo-random and secure numbers.
 Access Modifiers in C#
Sep 03, 2024 pm 03:24 PM
Guide to the Access Modifiers in C#. We have discussed the Introduction Types of Access Modifiers in C# along with examples and outputs.
 C# Data Grid View
Sep 03, 2024 pm 03:32 PM
Guide to C# Data Grid View. Here we discuss the examples of how a data grid view can be loaded and exported from the SQL database or an excel file.
 Patterns in C#
Sep 03, 2024 pm 03:33 PM
Guide to Patterns in C#. Here we discuss the introduction and top 3 types of Patterns in C# along with its examples and code implementation.
 C# Serialization
Sep 03, 2024 pm 03:30 PM
Guide to C# Serialization. Here we discuss the introduction, steps of C# serialization object, working, and example respectively.
 Prime Numbers in C#
Sep 03, 2024 pm 03:35 PM
Guide to Prime Numbers in C#. Here we discuss the introduction and examples of prime numbers in c# along with code implementation.
 Web Services in C#
Sep 03, 2024 pm 03:32 PM
Guide to Web Services in C#. Here we discuss an introduction to Web Services in C# with technology use, limitation, and examples.


