
The previous article about Visual Studio debugging skills aroused so much interest that I decided to share more debugging knowledge. In the following list you can see debugging tips for writing native development (numbered following the previous article). These tips can be applied to VS2005 or newer versions (of course some can be applied to older versions). If you continue, you can learn the details of each tip.
Tip 11: Data Breakpoint
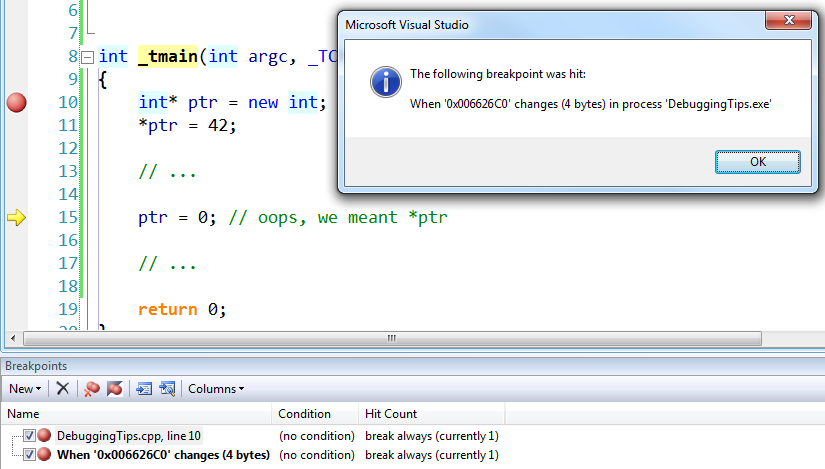
When the memory location of the data changes, the debugger will break. However, it is only possible to create 4 data breakpoints at one time with such hardware. Data breakpoints can only be added during compilation, and can be added through the menu (Compile>New Breakpoint>New Data Breakpoint) or through the breakpoint window.

You can use a memory address or an address expression. Even though you can see both values on the stack, I think this feature is usually only useful when the value on the heap has been changed. This is a great help in identifying memory corruption.
In the following example, the value of the pointer has been changed to the value of the object pointed to. In order to find out where the changes were made, I set a breakpoint where the pointer value is stored, such as &ptr (note that this happens after the pointer is initialized). When the data changes, assuming someone changed the value of the pointer, the debugger terminates and can discover what code caused the change.
Tip 12: Thread Renaming
When you debug a multi-threaded application, the Threads window will show which threads were created and the current thread. The more threads there are, the harder it is for you to find the thread you are looking for (especially when the same program is executed by multiple threads at the same time, you don’t know which thread instance is currently executing)

The debugger allows you to rename threads. Right-click a thread and rename it.
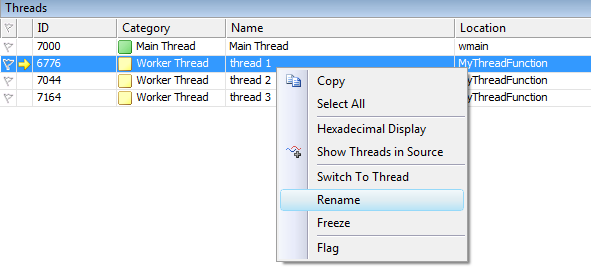
It is also possible to name threads programmatically, although this is a bit tricky and must be done after the thread has been started, otherwise the debugger will rename it with its default naming convention. Initialization, the following function shows how to define and use a thread.
typedef struct tagTHREADNAME_INFO
{
  DWORD dwType;    // 必须是两个字节的长度
  LPCSTR szName;    // 指针指向命名 (同一个地址空间)
  DWORD dwThreadID;  // 线程ID(-1调用线程)
  DWORD dwFlags;    // 保留待用,多数情况下为0
} THREADNAME_INFO;

void SetThreadName(DWORD dwThreadID, LPCSTR szThreadName)
{
  THREADNAME_INFO info;
  info.dwType = 0x1000;
  info.szName = szThreadName;
  info.dwThreadID = dwThreadID;
  info.dwFlags = 0;

  __try
  {
    RaiseException(0x406D1388, 0, sizeof(info)/sizeof(DWORD), (DWORD*)&info);
  }
  __except (EXCEPTION_CONTINUE_EXECUTION)
  {
  }
}Tip 13: Set breakpoints on specific threads
For multi-threaded applications, another useful tip is to set breakpoints on specific threads, processes or even computers. You can use the breakpoint Filer command to achieve this function.
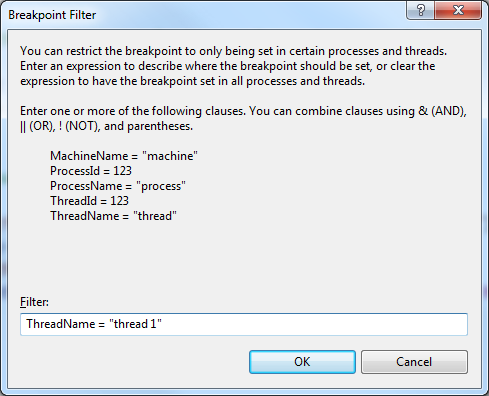
The debugger allows you to use different combinations of thread name, thread ID, process name, process ID, and machine name (using AND, OR, NOT connections). Knowing how to set thread names also makes this filtering technique easier to operate.
Tip 14: (Inaccurate) Timing Execution
In my previous article I mentioned using dummy variables in the Watch window. One that is not mentioned is @clk, which can display the value of a counter to obtain the approximate time required for code execution between two breakpoints. The unit of this value is milliseconds (ms). However, this method cannot be used to configure program execution. You should use Visual Studio Profiler or Performance Timer to complete these configurations.
Reset the timer by adding @clk=0 in the Watch window or Immediate window. Therefore, if you need to calculate the time required to execute the last section of code, do the following:
Set a breakpoint at the beginning of the code block
Set a breakpoint at the end of the code block
Add @clk in the Watch window
When the first breakpoint is triggered, enter @clk=0 in the Intermediate window
Run the program until the end of the code block is encountered Breakpoint at the location and view the value of @clk in the Watch window
Note that there are tips on the Internet that you need to add two expressions in the Watch window: @clk and @clk=0. It is said that you can The timer is reset at the point where the breakpoint is executed. This technique can only be used in lower versions of Visual Studio, but cannot be used in higher versions of VS, such as VS2005 (the author has tested it, and vs2005 does not support this technique) and higher versions.
Tip 15: Formatting Numbers
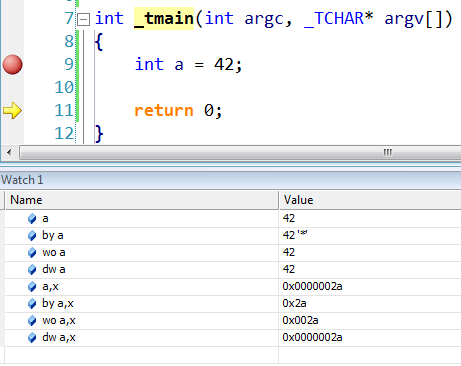
当你使用Watch或者Quick Watch窗口查看变量时,显示这些数值是用默认的预定义可视化格式。当变量是数字时,显示形式按照他们的类型(int、float、double)来的,并且使用十进制显示。然而,你可以设置调试器在显示数字的使用使用不同的类型,或者使用不同的进制。
改变变量显示类型可以在变量前添加以下前缀:
by —— unsigned char(unsigned byte)
wo —— unsigned short(unsigned word)
dw —— unsigned long(unsigned double word)
改变变量显示的进制可以在变量前添加以下前缀:
d或i —— 有符号十进制数
u —— 无符号十进制数
o —— 无符号八进制数
x —— 小写十六进制数
X —— 大写十六进制数
技巧16:格式化内存数据
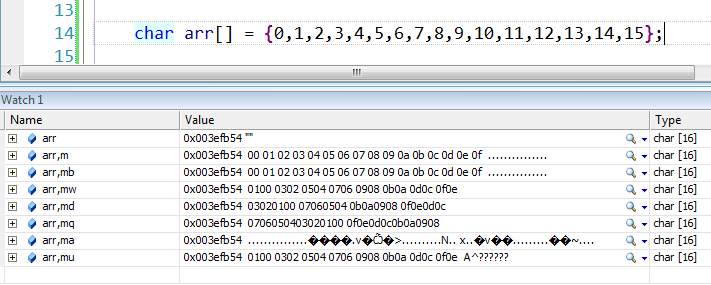
除了数字,debugger还可以在Watch窗口中显示格式化的内存数据,最长为64字节。你可以在表达式(变量或者内存地址)后面添加下面的后缀来格式化数据:
mb或m —— 十六进制显示的16字节数据,后面跟着16个ASCII字符
mw —— 8字(WORD,通常1 WORD = 2 BYTE)数据
md —— 4个双字(DWORD,通常1 DWORD = 4 BYTE)数据
mq —— 2个四字(Quad WORD)数据
ma —— 64个ASCII字符
mu —— 2字节UNICODE字符
技巧17:在系统DLL调用处暂停
有时在DLL的某个函数被调用时暂停是很有用,特别是系统DLL(比如kernel32.dll、user32.dll)。实现这种暂停需要使用原生debugger提供的上下文运算符。你可以设定断点位置、变量名或者表达式:
{[函数],[源代码],[模块]}断点位置
{[函数],[源代码],[模块]}变量名
{[函数],[源代码],[模块]}表达式
大括号内可以是函数名、源代码及模块的任意组合,但是逗号不能省略。
举个例子如果我们需要在CreateThread函数调用时暂停。这个函数是从kernel32.dll导出的,因此上下文运算符应该是这样子的:{,,kernel32.dll}CreateThread。然而,这样并不行,因为该运算符需要CreateThread修饰之后的名字。可以使用 DBH.exe来获得一个特定函数的修饰名(编译器编译生成)。
下面是如何获得CreateThread的修饰名的方法:
C:\Program Files (x86)\Debugging Tools for Windows (x86)>dbh.exe -s:srv*C:\Symbo
ls*http://msdl.microsoft.com/Download/Symbols -d C:\Windows\SysWOW64\kernel32.dl
l enum *CreateThread*
Symbol Search Path: srv*C:\Symbols*http://msdl.microsoft.com/Download/Symbols

 index      address   name
   1      10b4f65 :  _BaseCreateThreadPoolThread@12
   2      102e6b7 :  _CreateThreadpoolWork@12
   3      103234c :  _CreateThreadpoolStub@4
   4      1011ea8 :  _CreateThreadStub@24
   5      1019d40 :  _NtWow64CsrBasepCreateThread@12
   6      1019464 :  ??_C@_0BC@PKLIFPAJ@SHCreateThreadRef?$AA@
   7      107309c :  ??_C@_0BD@CIEDBPNA@TF_CreateThreadMgr?$AA@
   8      102ce87 :  _CreateThreadpoolCleanupGroupStub@0
   9      1038fe3 :  _CreateThreadpoolIoStub@16
   a      102e6f0 :  _CreateThreadpoolTimer@12
   b      102e759 :  _CreateThreadpoolWaitStub@12
   c      102ce8e :  _CreateThreadpoolCleanupGroup@0
   d      102e6e3 :  _CreateThreadpoolTimerStub@12
   e      1038ff0 :  _CreateThreadpoolIo@16
   f      102e766 :  _CreateThreadpoolWait@12
  10      102e6aa :  _CreateThreadpoolWorkStub@12
  11      1032359 :  _CreateThreadpool@4
看起来真实的名字是_CreateThreadStub@24。因此我们可以创建断点,{,,kernel32.dll}_CreateThreadStub@24。
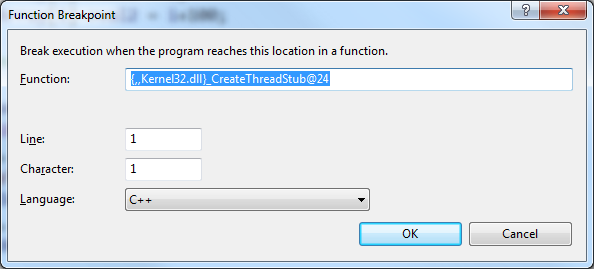
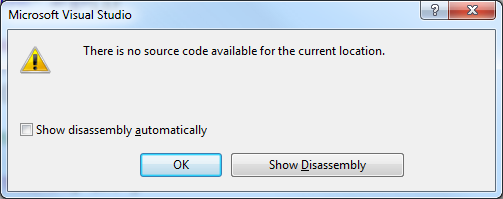
运行程序,当遇到暂停时,直接忽略关于在断点位置无相关源代码的消息提示。
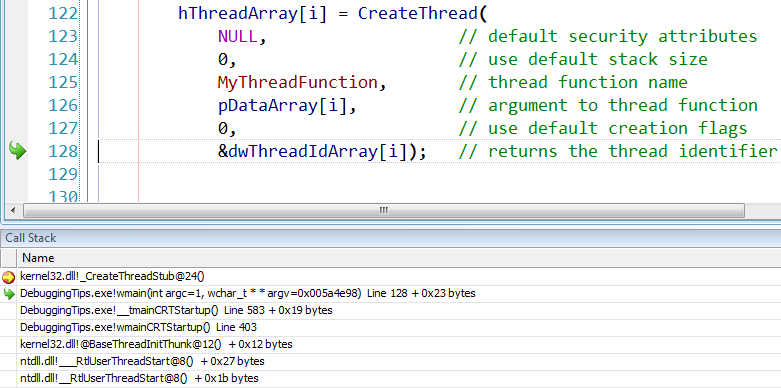
使用调用堆栈窗口来查看调用这个函数的代码。
技巧18:载入符号
当你调试程序的时候,调用堆栈窗口有可能不会显示全部的调用堆栈,其中忽略系统DLL(例如kernel32.dll, user32.dll)的信息。
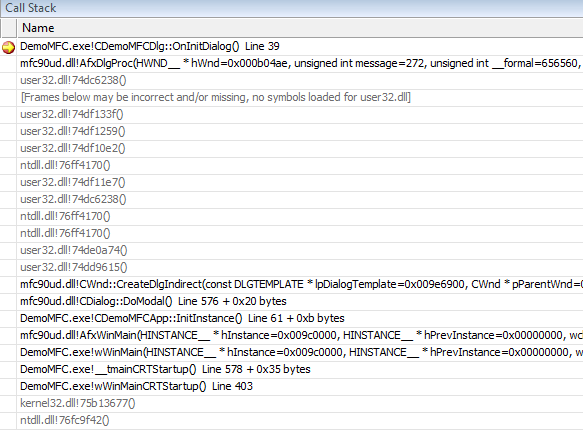
通过加载这些DLL的符号信息,可以获得全部调用堆栈信息,并且在调用堆栈窗口,使用上下文菜单(右键菜单),直接设置这种效果。你可以从预定义的符号路径或者微软的符号服务器(针对系统DLL)下载这些符号。在这些符号下载并导入到debugger中之后,调用堆栈更新如下:
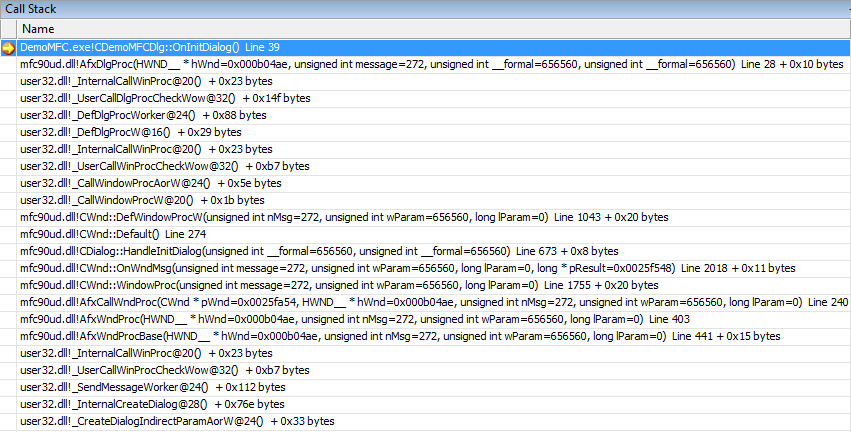
这些符号也可以从Module窗口导入。

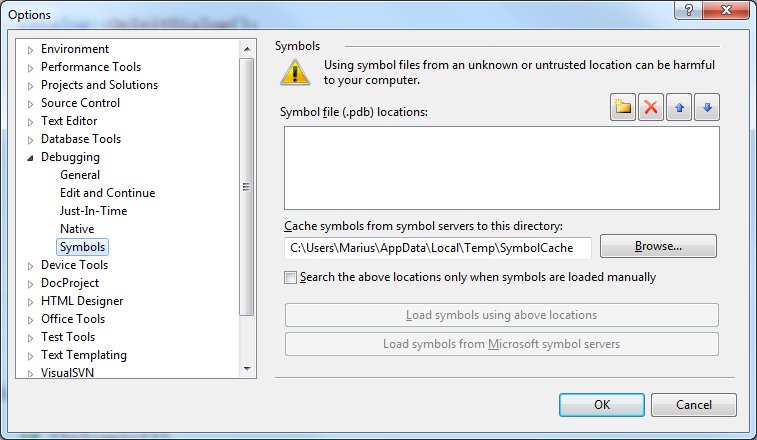
一旦载入之后,这些符号会保存在缓存中,并且可以在Tools>Options>Debugging>Symbols中配置。
技巧19:在MFC中报告内存泄露
如果你想在MFC应用程序中监测内存泄露,你可以使用宏DEBUG_NEW来重定义new运算符,这是new运算符的一个修改版本,可以记录其分配内存的文件名及行数。在Release版中构建的DEBUG_NEW会解析成原始的new运算符。
MFC向导产生的源代码中在#include后米娜包含如下预处理指令:
#ifdef _DEBUG
#define new DEBUG_NEW
#endif
上面代码就是如何重定义new运算符的方法。
很多STL头文件和这里定义的new运算符不兼容。如果你在重新定义运算符new之后包含了
1>c:\program files (x86)\microsoft visual studio 9.0\vc\include\xmemory(43) : error C2665: 'operator new' : none of the 5 overloads could convert all the argument types 1> c:\program files\microsoft visual studio 9.0\vc\include\new.h(85): could be 'void *operator new(size_t,const std::nothrow_t &) throw()' 1> c:\program files\microsoft visual studio 9.0\vc\include\new.h(93): or 'void *operator new(size_t,void *)' 1> while trying to match the argument list '(const char [70], int)' 1> c:\program files (x86)\microsoft visual studio 9.0\vc\include\xmemory(145) : see reference to function template instantiation '_Ty *std::_Allocate<char>(size_t,_Ty *)' being compiled 1> with 1> [ 1> _Ty=char 1> ] 1> c:\program files (x86)\microsoft visual studio 9.0\vc\include\xmemory(144) : while compiling class template member function 'char *std::allocator<_Ty>::allocate(std::allocator<_Ty>::size_type)' 1> with 1> [ 1> _Ty=char 1> ] 1> c:\program files (x86)\microsoft visual studio 9.0\vc\include\xstring(2216) : see reference to class template instantiation 'std::allocator<_Ty>' being compiled 1> with 1> [ 1> _Ty=char 1> ]
解决方法是在包含这些STL文件之后再使用DEBUG_NEW重定义new运算符。
技巧20:调试ATL
当你开发ATL COM组件时你可以在debugger中查看你所开发的COM对象的QueryInterface、AddRef和Release的调用情况。默认情况下并不支持这些调用的产看,你需要在预处理定义或者预编译头文件中定义两个宏。这两个宏定义之后,关于这些函数的调用会显示在输出(Output)窗口中。
这两个宏是:
_ATL_DEBUG_QI,显示每个被查询接口的名字。必须在atlcom.h头文件被包含之前定义。
_ATL_DEBUG_INTERFACES,每当AddRef或Release被调用时显示当前接口的引用次数以及类名、接口名等信息。必须在atlbase.h包含之前定义。
以上就是本文的全部内容,希望大家结合之前分享过的文章进行学习,熟练掌握Visual Studio调试技巧。
更多分享Visual Studio原生开发的10个调试技巧(2)相关文章请关注PHP中文网!
 Tutorial on making inscribed coins
 The phone cannot connect to the Bluetooth headset
 Compound usage
 vue common instructions
 What should I do if msconfig cannot be opened?
 What is the difference between Douyin and Douyin Express Edition?
 Property management system software
 Why can swoole be resident in memory?
 Domestic free ChatGPT encyclopedia


