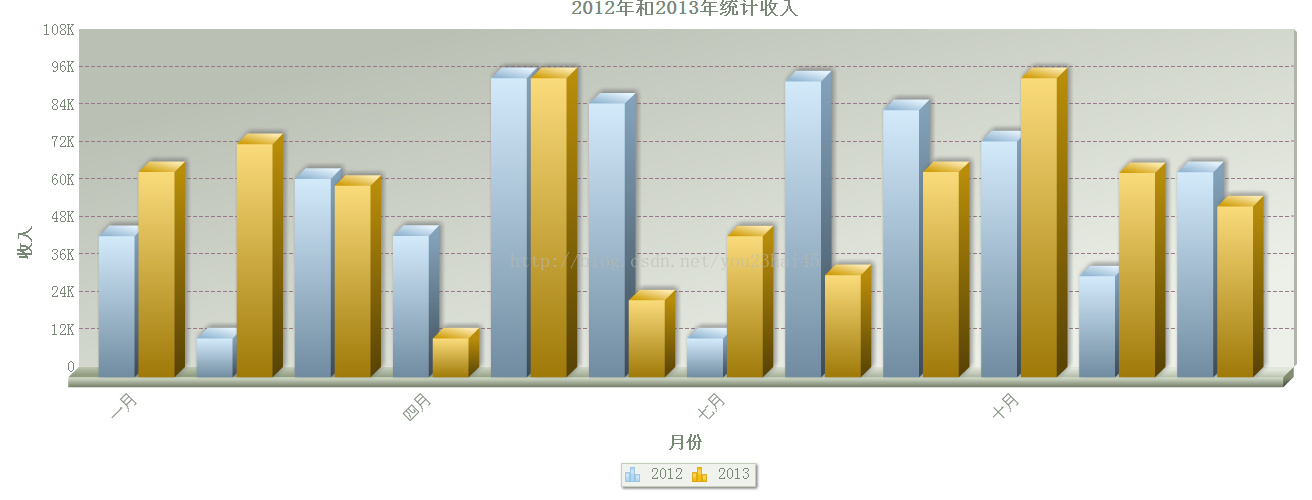
FusionCharts 3D Dual Bar Chart
1. The source code of the 3D double column chart page is as follows
doubleColumn3D.html:
<!DOCTYPE html>
<!--
To change this license header, choose License Headers in Project Properties.
To change this template file, choose Tools | Templates
and open the template in the editor.
-->
<html>
    <head>
        <title>FusionCharts 3D双柱状图</title>
        <meta charset="UTF-8">
        <meta name="viewport" content="width=device-width">
        <script type="text/javascript" src="../script/jquery-1.10.2.js"></script>
        <script type="text/javascript" src="../script/Charts/FusionCharts.js"></script>
        <style type="text/css">
            body{
                width:99%;
                height:100%;
                font-size:12px;
            }
            #doubleColumn3DChart{
                width:100%;
            }
        </style>
        <script type="text/javascript">
            $(function(){
                var column3D = new FusionCharts( "../script/Charts/MSColumn3D.swf", "myChartId", "100%", "520", "0" );
                column3D.setXMLUrl("data/doubleColumn3D.xml");
                column3D.render("doubleColumn3DChart");
            });
        </script>
    </head>
    <body>
        <p id="doubleColumn3DChart"></p>
    </body>
</html>2. 3D double column chart data source
##doubleColumn3D.xml:
<?xml version="1.0" encoding="UTF-8"?>
<chart caption='2012年和2013年统计收入' xAxisName='月份' yAxisName='收入' showValues='0' baseFont='微软雅黑' baseFontSize='14'
baseFontColor='#00FF00' outCnvBaseFont='宋体' outCnvBaseFontSize='16' outCnvBaseFontColor='#798777' showAboutMenuItem='1'
showLabels='1' labelDisplay='ROTATE ' useEllipsesWhenOverflow='1' rotateLabels='1' slantLabels='1' staggerLines='2'
labelStep='3' placeValuesInside='1' showYAxisValues='1' showLimits='1' showpLineValues='1' showShadow='1' adjustp='1'
setAdaptiveYMin='1' centerYaxisName='1' useRoundEdges='1' numpLines='8' pLineColor='#987989' pLineIsDashed='1'>
<categories>
<category label='一月' />
<category label='二月' />
<category label='三月' />
<category label='四月' />
<category label='五月' />
<category label='六月' />
<category label='七月' />
<category label='八月' />
<category label='九月' />
<category label='十月' />
<category label='十一月' />
<category label='十二月' />
</categories>
<dataset seriesName='2012'>
<set value='45155' />
<set value='12452'/>
<set value='63455' />
<set value='45233' />
<set value='95656' />
<set value='87545' />
<set value='12425' />
<set value='94633' />
<set value='85452' />
<set value='75455' />
<set value='32312' />
<set value='65625' />
</dataset>
<dataset seriesName='2013'>
<set value='65655'/>
<set value='74555'/>
<set value='61245'/>
<set value='12451'/>
<set value='95656' />
<set value='24655' />
<set value='45122' />
<set value='32656' />
<set value='65656' />
<set value='95666' />
<set value='65323' />
<set value='54656' />
</dataset>
</chart>3. The running result is as shown below
(1) During initialization

(2) When clicking on the legend 2012

(3) When clicking on the legend 2013

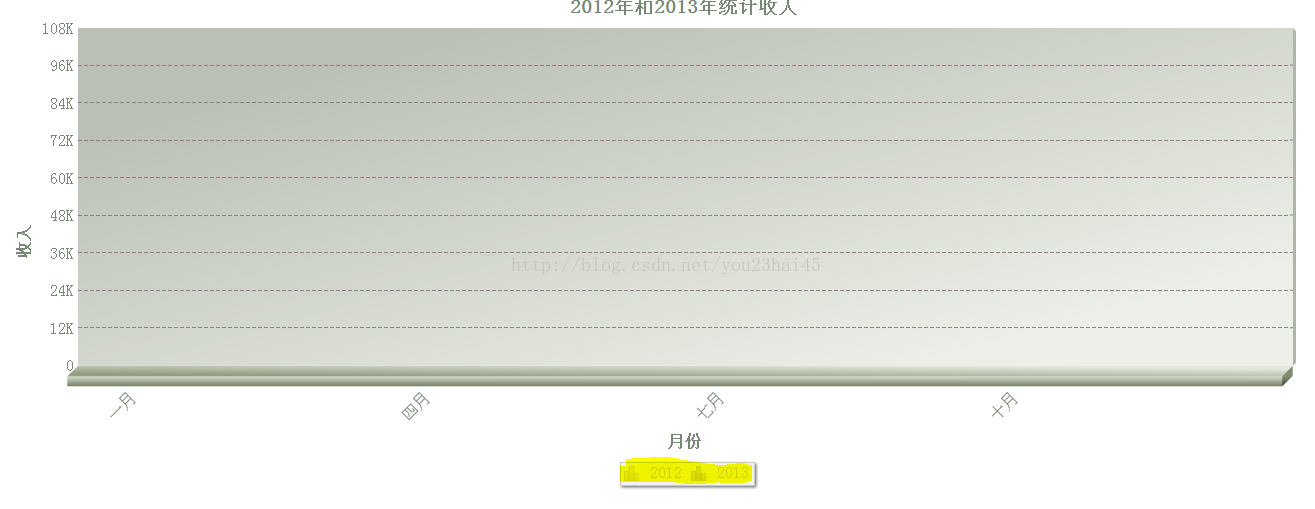
## (4) When clicking legend 2012 and legend 2013

The above is the content of FusionCharts 3D double bar chart. For more related content, please pay attention to PHP Chinese Net (www.php.cn)!

Hot AI Tools

Undresser.AI Undress
AI-powered app for creating realistic nude photos

AI Clothes Remover
Online AI tool for removing clothes from photos.

Undress AI Tool
Undress images for free

Clothoff.io
AI clothes remover

AI Hentai Generator
Generate AI Hentai for free.

Hot Article

Hot Tools

Notepad++7.3.1
Easy-to-use and free code editor

SublimeText3 Chinese version
Chinese version, very easy to use

Zend Studio 13.0.1
Powerful PHP integrated development environment

Dreamweaver CS6
Visual web development tools

SublimeText3 Mac version
God-level code editing software (SublimeText3)

Hot Topics
 1377
1377
 52
52
 Is the conversion speed fast when converting XML to PDF on mobile phone?
Apr 02, 2025 pm 10:09 PM
The speed of mobile XML to PDF depends on the following factors: the complexity of XML structure. Mobile hardware configuration conversion method (library, algorithm) code quality optimization methods (select efficient libraries, optimize algorithms, cache data, and utilize multi-threading). Overall, there is no absolute answer and it needs to be optimized according to the specific situation.
 How to convert XML files to PDF on your phone?
Apr 02, 2025 pm 10:12 PM
It is impossible to complete XML to PDF conversion directly on your phone with a single application. It is necessary to use cloud services, which can be achieved through two steps: 1. Convert XML to PDF in the cloud, 2. Access or download the converted PDF file on the mobile phone.
 How to convert XML to PDF on your phone?
Apr 02, 2025 pm 10:18 PM
It is not easy to convert XML to PDF directly on your phone, but it can be achieved with the help of cloud services. It is recommended to use a lightweight mobile app to upload XML files and receive generated PDFs, and convert them with cloud APIs. Cloud APIs use serverless computing services, and choosing the right platform is crucial. Complexity, error handling, security, and optimization strategies need to be considered when handling XML parsing and PDF generation. The entire process requires the front-end app and the back-end API to work together, and it requires some understanding of a variety of technologies.
 How to open web.xml
Apr 03, 2025 am 06:51 AM
To open a web.xml file, you can use the following methods: Use a text editor (such as Notepad or TextEdit) to edit commands using an integrated development environment (such as Eclipse or NetBeans) (Windows: notepad web.xml; Mac/Linux: open -a TextEdit web.xml)
 Recommended XML formatting tool
Apr 02, 2025 pm 09:03 PM
XML formatting tools can type code according to rules to improve readability and understanding. When selecting a tool, pay attention to customization capabilities, handling of special circumstances, performance and ease of use. Commonly used tool types include online tools, IDE plug-ins, and command-line tools.
 Is there any mobile app that can convert XML into PDF?
Apr 02, 2025 pm 08:54 PM
An application that converts XML directly to PDF cannot be found because they are two fundamentally different formats. XML is used to store data, while PDF is used to display documents. To complete the transformation, you can use programming languages and libraries such as Python and ReportLab to parse XML data and generate PDF documents.
 How to open xml format
Apr 02, 2025 pm 09:00 PM
Use most text editors to open XML files; if you need a more intuitive tree display, you can use an XML editor, such as Oxygen XML Editor or XMLSpy; if you process XML data in a program, you need to use a programming language (such as Python) and XML libraries (such as xml.etree.ElementTree) to parse.
 xml online formatting
Apr 02, 2025 pm 10:06 PM
XML Online Format Tools automatically organizes messy XML code into easy-to-read and maintain formats. By parsing the syntax tree of XML and applying formatting rules, these tools optimize the structure of the code, enhancing its maintainability and teamwork efficiency.


