
The JConsole tool is in the JDK/bin directory. After starting JConsole, it will automatically search for the jvm process running on the local machine. No jps command is needed to query and specify. Double-click one of the jvm processes to start monitoring, or use "remote process" to connect to the remote server.
#Enter the JConsole main interface, There are six tabs: "Overview", "Memory", "Threads", "Classes", "VM Summary" and "Mbean":
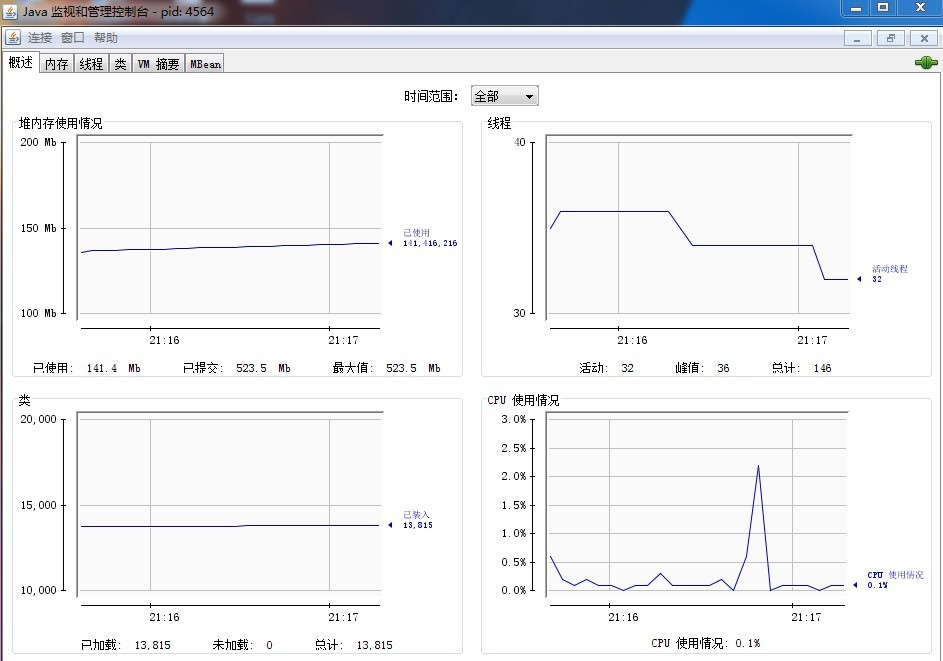
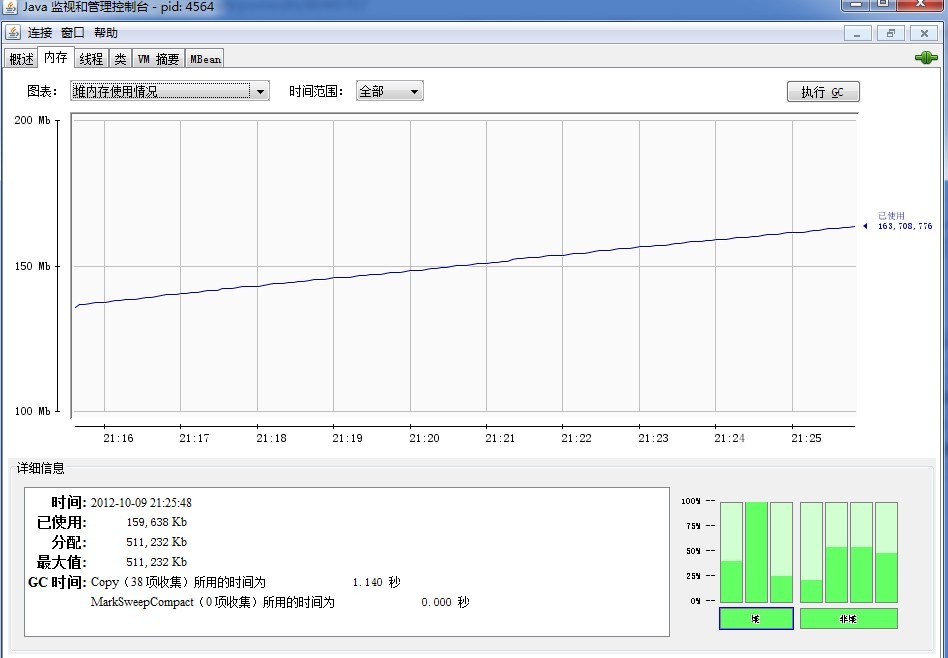
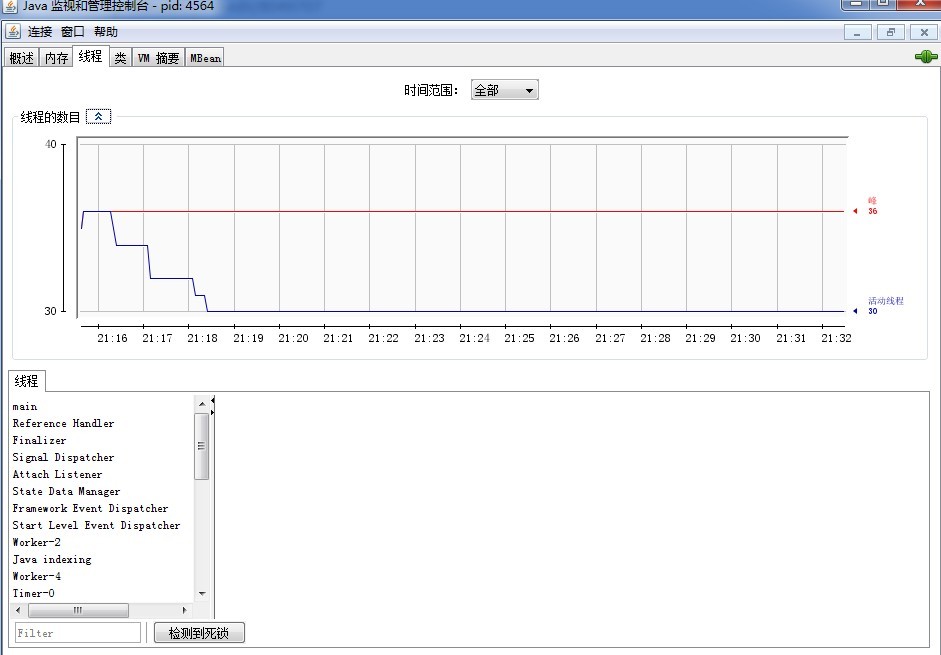
# #The last commonly used tab, the VM tab, can clearly understand and display the specified JVM parameters and heap information.
2.VisualVM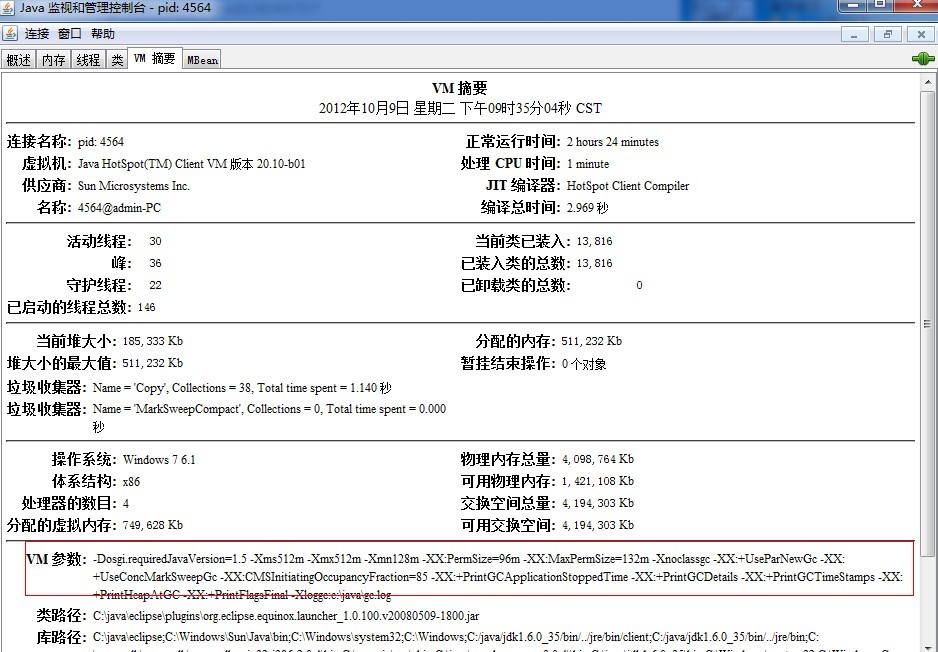
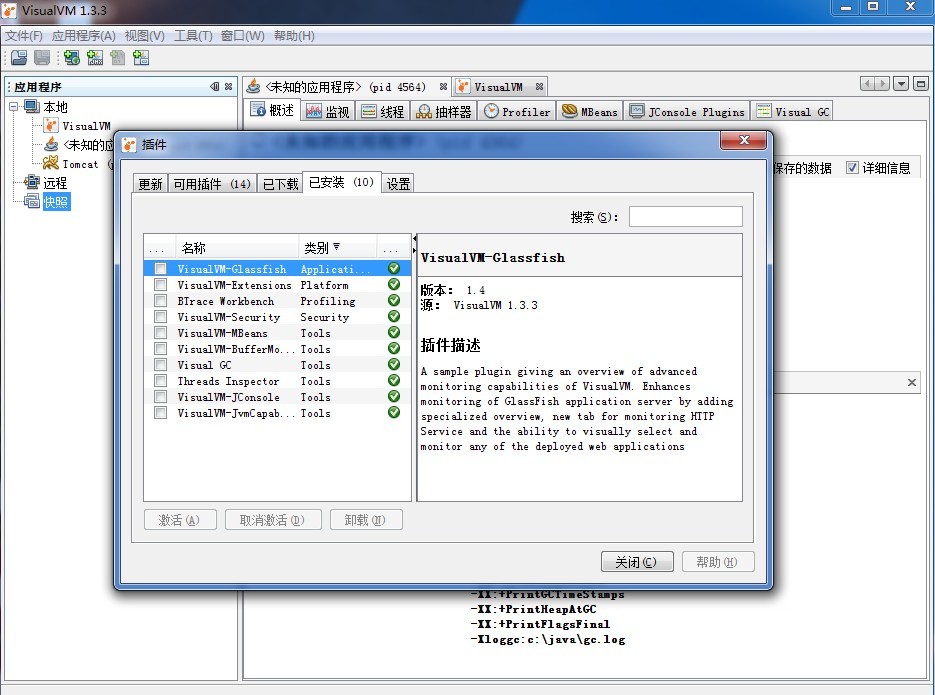
Install the plug-in: Tools - Plug-in
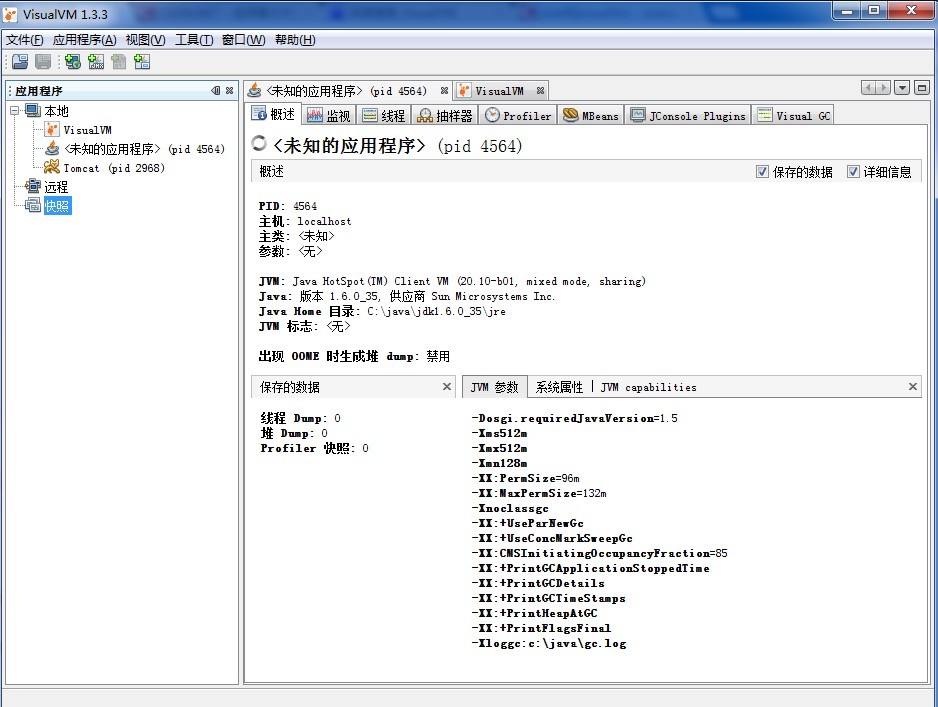
VisualVM main interface
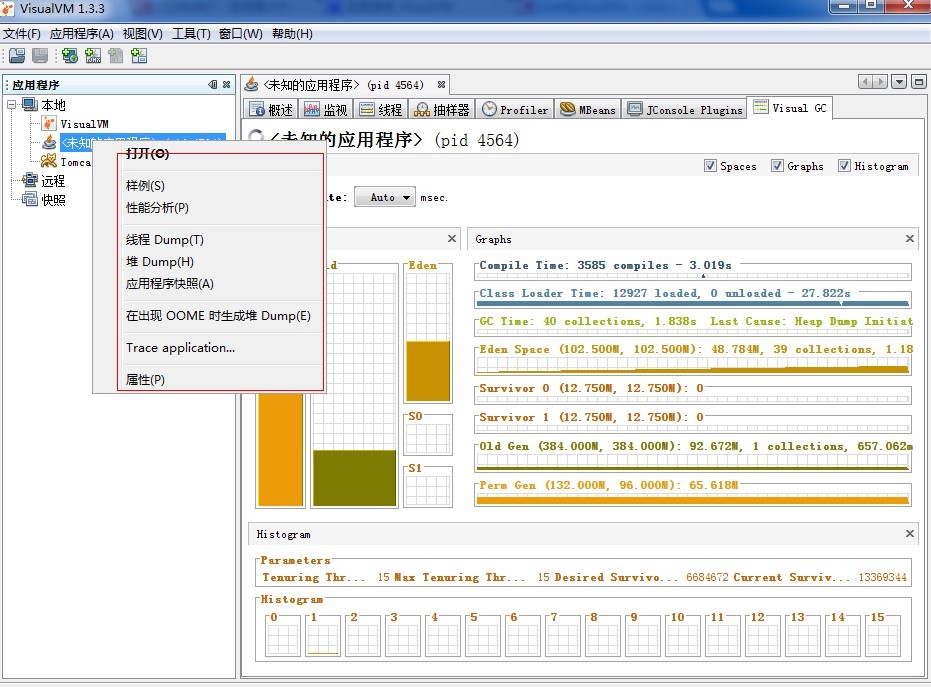
Generate dump file in VisualVM:
 3.
3.
jprofiler
The above is the content of Java virtual machine learning-JDK visual monitoring tool. For more related content, please pay attention to PHP Chinese Net (www.php.cn)!


