
In front-end development, there is a very important skill called breakpoint debugging.
In Chrome's developer tools, through breakpoint debugging, we can very conveniently observe the execution process of JavaScript step by step, and intuitively perceive the function call stack, scope chain, variable object, closure, this changes in key information. Therefore, breakpoint debugging plays a very important role in quickly locating code errors and quickly understanding the execution process of the code. This is also an essential advanced skill for our front-end developers.
Of course, if you don’t know enough about these basic concepts of JavaScript [execution context, variable objects, closures, this, etc.], it may be difficult to thoroughly master breakpoint debugging. But fortunately, in the previous articles, I have given a detailed overview of these concepts, so it should be relatively easy for everyone to master this skill.
In order to help everyone have a better understanding of this and closure, and because the definition of closure in the previous article is a bit biased, I will use closure-related examples in this article. Learn about breakpoint debugging so that everyone can make corrections in time. I admit my mistake here and misled everyone.
##1. Review of basic concepts
2. Understand breakpoint debugging tools

Resume/pause script execution
, the actual performance is not encountered When the function is reached, perform the next step. When a function is encountered, the next step is executed directly without entering the function.
Step into, the actual performance is that when the function is not encountered, the next step is executed. When a function is encountered, the function execution context is entered.
Step out of the current function
Deactivate breakpoints
Non-pause exception capture
3. Breakpoint settings
##4. Example
Next, we use For some examples, let’s use the breakpoint debugging tool to see how our demo function performs during execution.
// demo01

var fn;
function foo() {
    var a = 2;
    function baz() {
        console.log( a );
    }
    fn = baz;
}
function bar() {
    fn();
}

foo();
bar(); // 2Before reading further, we can stop and think about it, who is the closure in this example?
这是来自《你不知道的js》中的一个例子。由于在使用断点调试过程中,发现chrome浏览器理解的闭包与该例子中所理解的闭包不太一致,因此专门挑出来,供大家参考。我个人更加倾向于chrome中的理解。
● 第一步:设置断点,然后刷新页面。

● 第二步:点击上图红色箭头指向的按钮(step into),该按钮的作用会根据代码执行顺序,一步一步向下执行。在点击的过程中,我们要注意观察下方call stack 与 scope的变化,以及函数执行位置的变化。
一步一步执行,当函数执行到上例子中

我们可以看到,在chrome工具的理解中,由于在foo内部声明的baz函数在调用时访问了它的变量a,因此foo成为了闭包。这好像和我们学习到的知识不太一样。我们来看看在《你不知道的js》这本书中的例子中的理解。

书中的注释可以明显的看出,作者认为fn为闭包。即baz,这和chrome工具中明显是不一样的。
而在备受大家推崇的《JavaScript高级编程》一书中,是这样定义闭包。


这里chrome中理解的闭包,与我所阅读的这几本书中的理解的闭包不一样。具体这里我先不下结论,但是我心中更加偏向于相信chrome浏览器。
我们修改一下demo01中的例子,来看看一个非常有意思的变化。
// demo02
var fn;
var m = 20;
function foo() {
    var a = 2;
    function baz(a) {
        console.log(a);
    }
    fn = baz;
}
function bar() {
    fn(m);
}

foo();
bar(); // 20这个例子在demo01的基础上,我在baz函数中传入一个参数,并打印出来。在调用时,我将全局的变量m传入。输出结果变为20。在使用断点调试看看作用域链。
是不是结果有点意外,闭包没了,作用域链中没有包含foo了。我靠,跟我们理解的好像又有点不一样。所以通过这个对比,我们可以确定闭包的形成需要两个条件。
● 在函数内部创建新的函数;
● 新的函数在执行时,访问了函数的变量对象;
还有更有意思的。
我们继续来看看一个例子。
// demo03

function foo() {
    var a = 2;

    return function bar() {
        var b = 9;

        return function fn() {
            console.log(a);
        }
    }
}

var bar = foo();
var fn = bar();
fn();在这个例子中,fn只访问了foo中的a变量,因此它的闭包只有foo。

修改一下demo03,我们在fn中也访问bar中b变量试试看。
// demo04

function foo() {
    var a = 2;

    return function bar() {
        var b = 9;

        return function fn() {
            console.log(a, b);
        }
    }
}

var bar = foo();
var fn = bar();
fn();
这个时候,闭包变成了两个。分别是bar,foo。
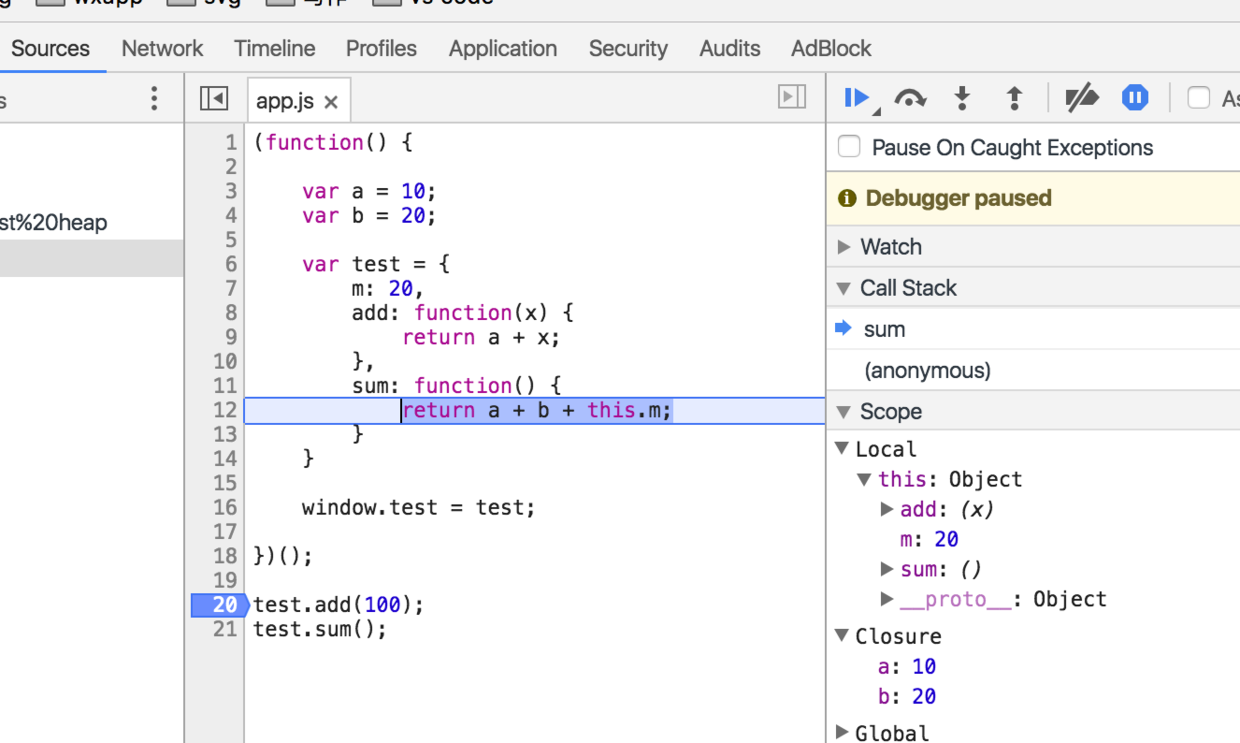
我们知道,闭包在模块中的应用非常重要。因此,我们来一个模块的例子,也用断点工具来观察一下。
// demo05
(function() {

    var a = 10;
    var b = 20;

    var test = {
        m: 20,
        add: function(x) {
            return a + x;
        },
        sum: function() {
            return a + b + this.m;
        },
        mark: function(k, j) {
            return k + j;
        }
    }

    window.test = test;

})();

test.add(100);
test.sum();
test.mark();

var _mark = test.mark();
_mark();

注意:这里的this指向显示为Object或者Window,大写开头,他们表示的是实例的构造函数,实际上this是指向的具体实例
上面的所有调用,最少都访问了自执行函数中的test变量,因此都能形成闭包。即使mark方法没有访问私有变量a,b。
我们还可以结合点断调试的方式,来理解那些困扰我们很久的this指向。随时观察this的指向,在实际开发调试中非常有用。
// demo06

var a = 10;
var obj = {
    a: 20
}

function fn () {
    console.log(this.a);
}

fn.call(obj); // 20更多的例子,大家可以自行尝试,总之,学会了使用断点调试之后,我们就能够很轻松的了解一段代码的执行过程了。这对快速定位错误,快速了解他人的代码都有非常巨大的帮助。大家一定要动手实践,把它给学会。
Finally, based on the above exploration situation, let’s summarize the closure again:
The closure is only confirmed to be created when the function is called and executed.
The formation of closures is directly related to the access sequence of the scope chain.
A closure will be formed only when the internal function accesses the variable object in the upper scope chain. Therefore, we can use closures to access variables inside the function.
The closure understood in chrome is very different from the closure understood in "JS You Don't Know" and "JavaScript Advanced Programming". I personally tend to believe in chrome. I won’t jump to conclusions here. You can confirm it yourself after exploring based on my ideas. In a previous article, I made a definition based on what I learned from the book. I think it was wrong. It has been revised now. I'm sorry to everyone.
 Is python front-end or back-end?
 How to implement instant messaging on the front end
 The difference between front-end and back-end
 Introduction to the relationship between php and front-end
 Usage of setInterval in JS
 Usage of gettickcount function
 What file is .exe
 What are the file server software?


