

During the development process, although I feel that optimizing SQL statements is very important, more emphasis is often placed on functional implementation. In order to make myself more efficient in writing MySQL statements in the future, it is necessary to make a small summary of MySQL optimization.
show [session|gobal] status
The session level indicates the statistics of the current connection results.
The global level represents the statistical results since the data was last started.
If you do not write a level, the default is the session level
eg: SHOW GLOBAL STATUS;
| Variable_name | Value |
| Aborted_clients | 6 |
| Aborted_connects | 0 |
| Binlog_cache_disk_use | 0 |
| Binlog_cache_use | 0 |
| Binlog_stmt_cache_disk_use | 0 |
| Binlog_stmt_cache_use | 0 |
| Bytes_received | 95645 |
| Bytes_sent | 1285066 |
| Com_admin_commands | 0 |
| Com_assign_to_keycache | 0 |
| Com_alter_db | 0 |
| Com_alter_db_upgrade | 0 |
| Com_alter_event | 0 |
| Com_alter_function | 0 |
| Com_alter_procedure | 0 |
| Com_alter_server | 0 |
| Com_alter_table | 6 |
| Com_alter_tablespace | 0 |
| Com_alter_user | 0 |
| Com_analyze | 0 |
| Com_begin | 0 |
| Com_binlog | 0 |
| Com_call_procedure | 0 |
| Com_change_db | 8 |
| Com_change_master | 0 |
| Com_check | 0 |
| Com_checksum | 0 |
| Com_commit | 0 |
| Com_create_db | 0 |
| Com_create_event | 0 |
| Com_create_function | 0 |
| Com_create_index | 0 |
| Com_create_procedure | 0 |
| Com_create_server | 0 |
| Com_create_table | 5 |
| Com_create_trigger | 0 |
| Com_create_udf | 0 |
| Com_create_user | 0 |
| Com_create_view | 6 |
| Com_dealloc_sql | 0 |
| Com_delete | 2 |
| Com_delete_multi | 0 |
| Com_do | 0 |
| Com_drop_db | 0 |
| Com_drop_event | 0 |
| Com_drop_function | 0 |
| Com_drop_index | 0 |
| Com_drop_procedure | 0 |
| Com_drop_server | 0 |
| Com_drop_table | 0 |
| Com_drop_trigger | 0 |
| Com_drop_user | 0 |
| Com_drop_view | 1 |
| Com_empty_query | 2 |
| Com_execute_sql | 0 |
| Com_flush | 0 |
| Com_get_diagnostics | 0 |
| Com_grant | 0 |
| Com_ha_close | 0 |
| Com_ha_open | 0 |
| Com_ha_read | 0 |
| Com_help | 0 |
| Com_insert | 15 |
| Com_insert_select | 0 |
| Com_install_plugin | 0 |
| Com_kill | 0 |
| Com_load | 0 |
| Com_lock_tables | 0 |
| Com_optimize | 0 |
| Com_preload_keys | 0 |
| Com_prepare_sql | 0 |
| Com_purge | 0 |
| Com_purge_before_date | 0 |
| Com_release_savepoint | 0 |
| Com_rename_table | 0 |
| Com_rename_user | 0 |
| Com_repair | 0 |
| Com_replace | 0 |
| Com_replace_select | 0 |
| Com_reset | 0 |
| Com_resignal | 0 |
| Com_revoke | 0 |
| Com_revoke_all | 0 |
| Com_rollback | 0 |
| Com_rollback_to_savepoint | 0 |
| Com_savepoint | 0 |
| Com_select | 414 |
| Com_set_option | 525 |
| Com_signal | 0 |
| Com_show_binlog_events | 0 |
| Com_show_binlogs | 0 |
| Com_show_charsets | 0 |
| Com_show_collations | 0 |
| Com_show_create_db | 0 |
| Com_show_create_event | 0 |
| Com_show_create_func | 0 |
| Com_show_create_proc | 0 |
| Com_show_create_table | 260 |
| Com_show_create_trigger | 0 |
| Com_show_databases | 8 |
| Com_show_engine_logs | 0 |
| Com_show_engine_mutex | 0 |
| Com_show_engine_status | 0 |
| Com_show_events | 0 |
| Com_show_errors | 0 |
| Com_show_fields | 102 |
| Com_show_function_code | 0 |
| Com_show_function_status | 0 |
| Com_show_grants | 0 |
| Com_show_keys | 86 |
| Com_show_master_status | 0 |
| Com_show_open_tables | 0 |
| Com_show_plugins | 0 |
| Com_show_privileges | 0 |
| Com_show_procedure_code | 0 |
| Com_show_procedure_status | 0 |
| Com_show_processlist | 1 |
| Com_show_profile | 0 |
| Com_show_profiles | 115 |
| Com_show_relaylog_events | 0 |
| Com_show_slave_hosts | 0 |
| Com_show_slave_status | 0 |
| Com_show_status | 247 |
| Com_show_storage_engines | 0 |
| Com_show_table_status | 1 |
| Com_show_tables | 14 |
| Com_show_triggers | 5 |
| Com_show_variables | 5 |
| Com_show_warnings | 0 |
| Com_slave_start | 0 |
| Com_slave_stop | 0 |
| Com_stmt_close | 0 |
| Com_stmt_execute | 0 |
| Com_stmt_fetch | 0 |
| Com_stmt_prepare | 0 |
| Com_stmt_reprepare | 0 |
| Com_stmt_reset | 0 |
| Com_stmt_send_long_data | 0 |
| Com_truncate | 0 |
| Com_uninstall_plugin | 0 |
| Com_unlock_tables | 0 |
| Com_update | 27 |
| Com_update_multi | 0 |
| Com_xa_commit | 0 |
| Com_xa_end | 0 |
| Com_xa_prepare | 0 |
| Com_xa_recover | 0 |
| Com_xa_rollback | 0 |
| Com_xa_start | 0 |
| Compression | ON |
| Connection_errors_accept | 0 |
| Connection_errors_internal | 0 |
| Connection_errors_max_connections | 0 |
| Connection_errors_peer_address | 0 |
| Connection_errors_select | 0 |
| Connection_errors_tcpwrap | 0 |
| Connections | 10 |
| Created_tmp_disk_tables | 128 |
| Created_tmp_files | 5 |
| Created_tmp_tables | 910 |
| Delayed_errors | 0 |
| Delayed_insert_threads | 0 |
| Delayed_writes | 0 |
| Flush_commands | 1 |
| Handler_commit | 108 |
| Handler_delete | 2 |
| Handler_discover | 0 |
| Handler_external_lock | 782 |
| Handler_mrr_init | 0 |
| Handler_prepare | 0 |
| Handler_read_first | 73 |
| Handler_read_key | 2109 |
| Handler_read_last | 0 |
| Handler_read_next | 42 |
| Handler_read_prev | 0 |
| Handler_read_rnd | 1882 |
| Handler_read_rnd_next | 94791 |
| Handler_rollback | 0 |
| Handler_savepoint | 0 |
| Handler_savepoint_rollback | 0 |
| Handler_update | 195 |
| Handler_write | 93316 |
| Innodb_buffer_pool_dump_status | not started |
| Innodb_buffer_pool_load_status | not started |
| Innodb_buffer_pool_pages_data | 397 |
| Innodb_buffer_pool_bytes_data | 6504448 |
| Innodb_buffer_pool_pages_dirty | 0 |
| Innodb_buffer_pool_bytes_dirty | 0 |
| Innodb_buffer_pool_pages_flushed | 193 |
| Innodb_buffer_pool_pages_free | 7795 |
| Innodb_buffer_pool_pages_misc | 0 |
| Innodb_buffer_pool_pages_total | 8192 |
| Innodb_buffer_pool_read_ahead_rnd | 0 |
| Innodb_buffer_pool_read_ahead | 0 |
| Innodb_buffer_pool_read_ahead_evicted | 0 |
| Innodb_buffer_pool_read_requests | 4642 |
| Innodb_buffer_pool_reads | 364 |
| Innodb_buffer_pool_wait_free | 0 |
| Innodb_buffer_pool_write_requests | 872 |
| Innodb_data_fsyncs | 129 |
| Innodb_data_pending_fsyncs | 0 |
| Innodb_data_pending_reads | 0 |
| Innodb_data_pending_writes | 0 |
| Innodb_data_read | 6033408 |
| Innodb_data_reads | 402 |
| Innodb_data_writes | 281 |
| Innodb_data_written | 6534656 |
| Innodb_dblwr_pages_written | 193 |
| Innodb_dblwr_writes | 14 |
| Innodb_have_atomic_builtins | ON |
| Innodb_log_waits | 0 |
| Innodb_log_write_requests | 574 |
| Innodb_log_writes | 46 |
| Innodb_os_log_fsyncs | 61 |
| Innodb_os_log_pending_fsyncs | 0 |
| Innodb_os_log_pending_writes | 0 |
| Innodb_os_log_written | 202752 |
| Innodb_page_size | 16384 |
| Innodb_pages_created | 34 |
| Innodb_pages_read | 363 |
| Innodb_pages_written | 193 |
| Innodb_row_lock_current_waits | 0 |
| Innodb_row_lock_time | 0 |
| Innodb_row_lock_time_avg | 0 |
| Innodb_row_lock_time_max | 0 |
| Innodb_row_lock_waits | 0 |
| Innodb_rows_deleted | 0 |
| Innodb_rows_inserted | 3 |
| Innodb_rows_read | 406 |
| Innodb_rows_updated | 2 |
| Innodb_num_open_files | 32 |
| Innodb_truncated_status_writes | 0 |
| Innodb_available_undo_logs | 128 |
| Key_blocks_not_flushed | 0 |
| Key_blocks_unused | 14344 |
| Key_blocks_used | 3 |
| Key_read_requests | 381 |
| Key_reads | 1 |
| Key_write_requests | 117 |
| Key_writes | 50 |
| Last_query_cost | 0.000000 |
| Last_query_partial_plans | 0 |
| Max_used_connections | 3 |
| Not_flushed_delayed_rows | 0 |
| Open_files | 70 |
| Open_streams | 0 |
| Open_table_definitions | 120 |
| Open_tables | 117 |
| Opened_files | 1042 |
| Opened_table_definitions | 144 |
| Opened_tables | 147 |
| Performance_schema_accounts_lost | 0 |
| Performance_schema_cond_classes_lost | 0 |
| Performance_schema_cond_instances_lost | 0 |
| Performance_schema_digest_lost | 0 |
| Performance_schema_file_classes_lost | 0 |
| Performance_schema_file_handles_lost | 0 |
| Performance_schema_file_instances_lost | 0 |
| Performance_schema_hosts_lost | 0 |
| Performance_schema_locker_lost | 0 |
| Performance_schema_mutex_classes_lost | 0 |
| Performance_schema_mutex_instances_lost | 0 |
| Performance_schema_rwlock_classes_lost | 0 |
| Performance_schema_rwlock_instances_lost | 0 |
| Performance_schema_session_connect_attrs_lost | 0 |
| Performance_schema_socket_classes_lost | 0 |
| Performance_schema_socket_instances_lost | 0 |
| Performance_schema_stage_classes_lost | 0 |
| Performance_schema_statement_classes_lost | 0 |
| Performance_schema_table_handles_lost | 0 |
| Performance_schema_table_instances_lost | 0 |
| Performance_schema_thread_classes_lost | 0 |
| Performance_schema_thread_instances_lost | 0 |
| Performance_schema_users_lost | 0 |
| Prepared_stmt_count | 0 |
| Qcache_free_blocks | 1 |
| Qcache_free_memory | 1039896 |
| Qcache_hits | 0 |
| Qcache_inserts | 0 |
| Qcache_lowmem_prunes | 0 |
| Qcache_not_cached | 404 |
| Qcache_queries_in_cache | 0 |
| Qcache_total_blocks | 1 |
| Queries | 1888 |
| Questions | 1887 |
| Select_full_join | 1 |
| Select_full_range_join | 0 |
| Select_range | 23 |
| Select_range_check | 0 |
| Select_scan | 727 |
| Slave_heartbeat_period | 0.000 |
| Slave_last_heartbeat | |
| Slave_open_temp_tables | 0 |
| Slave_received_heartbeats | 0 |
| Slave_retried_transactions | 0 |
| Slave_running | OFF |
| Slow_launch_threads | 0 |
| Slow_queries | 0 |
| Sort_merge_passes | 0 |
| Sort_range | 0 |
| Sort_rows | 1964 |
| Sort_scan | 151 |
| Ssl_accept_renegotiates | 0 |
| Ssl_accepts | 0 |
| Ssl_callback_cache_hits | 0 |
| Ssl_cipher | |
| Ssl_cipher_list | |
| Ssl_client_connects | 0 |
| Ssl_connect_renegotiates | 0 |
| Ssl_ctx_verify_depth | 0 |
| Ssl_ctx_verify_mode | 0 |
| Ssl_default_timeout | 0 |
| Ssl_finished_accepts | 0 |
| Ssl_finished_connects | 0 |
| Ssl_server_not_after | |
| Ssl_server_not_before | |
| Ssl_session_cache_hits | 0 |
| Ssl_session_cache_misses | 0 |
| Ssl_session_cache_mode | NONE |
| Ssl_session_cache_overflows | 0 |
| Ssl_session_cache_size | 0 |
| Ssl_session_cache_timeouts | 0 |
| Ssl_sessions_reused | 0 |
| Ssl_used_session_cache_entries | 0 |
| Ssl_verify_depth | 0 |
| Ssl_verify_mode | 0 |
| Ssl_version | |
| Table_locks_immediate | 386 |
| Table_locks_waited | 0 |
| Table_open_cache_hits | 656 |
| Table_open_cache_misses | 130 |
| Table_open_cache_overflows | 0 |
| Tc_log_max_pages_used | 0 |
| Tc_log_page_size | 0 |
| Tc_log_page_waits | 0 |
| Threads_cached | 1 |
| Threads_connected | 2 |
| Threads_created | 3 |
| Threads_running | 1 |
| Uptime | 286258 |
| Uptime_since_flush_status | 286258 |
Main parameter description
Connections: The number of times the view connects to the mysql server
Uptime: Server working time
Slow_queries: The number of slow queries
Com_xxx indicates the number of times each xxx statement is executed
Com_select Number of times to execute select
Com_insert Number of times to execute insert, when inserting in batches, only 1 time is accumulated
Com_update Number of Update operations performed
Com_delete Number of delete operations performed
Innodb_rows_xxx type parameters are only valid for the innodb storage engine
Analysis: Through the above parameters, you can easily understand the application of the current database and insert updates Is it mainly query-based or query-based, and the execution ratio. The count corresponding to the update operation is the count of execution times, which will be accumulated regardless of submission or rollback.
Locate which SQL statements with low execution efficiency are located through the slow query log. Started with the --log-slow-queries[=file_name] option, mysqld writes a log file containing all SQL statements executed for more than long_query_time seconds. Regarding how to locate slow queries, you can click here (http://www.php.cn/)
In step 2, we can query the inefficient sql statement. Here we can obtain the mysql execution select information through explain or desc. .
#eg:
##EXPLAIN
SELECT
t0.*
FROM
t3 AS t0
LEFT JOIN `t2` AS t1
ON t0.`id1` = t1.`id1`
WHERE t0.id1 = 5 ;
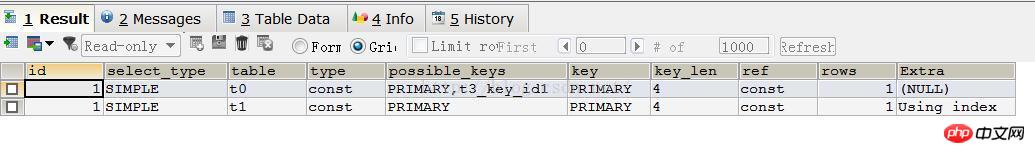
talbe: The table that outputs the result set.
possible_keys: Indexes that may be used during query
key: Actual index used
key_len: The length of the index field
rows: The number of scanned rows
Extra: Explanation and description of the execution
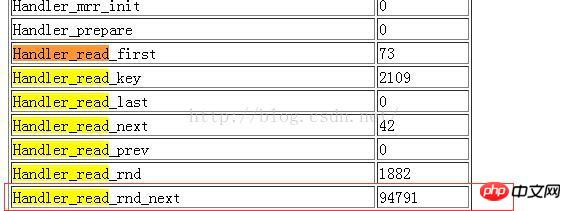
Step 4 : Determine the problem and take corresponding optimization measures
Note: If the index is working, the value of handler_read_key will be very high. This value represents the number of times a row is read by the index value. A very low value table name increases the performance obtained by the index. The improvement is not high because the index is not used very often.
A high value of handler_read_rnd_next means that the query is running inefficiently and index remediation should be established. If a large number of table scans are being performed and the handler_read_rnd_next value is high, it usually indicates that the table index is incorrect or the query written does not utilize the index, as shown below.
##We should Regularly analyze the table and check the table
Check the table using the following command (check the t3 table)
ANALYZE TABLE t3;
CHECK TABLE t3 ;
The command to regularly optimize the table is as follows
optimize table table name
Common statement optimization
(1) If data is inserted from the same client, try to use insert statements and multi-row inserts of multiple word tables to reduce Single row insertion, this method greatly reduces the consumption of direct connection and shutdown between the client and the database. eg:
INSERT INTO t3 VALUES(1,2),(8,5),(6,5),(4,3)
(2) If you insert many rows from different clients, you can get higher speed by using the inset delayed statement.
(3) If you perform batch insertion, you can increase the bulk_insert_buffer_size variable method to increase the speed.
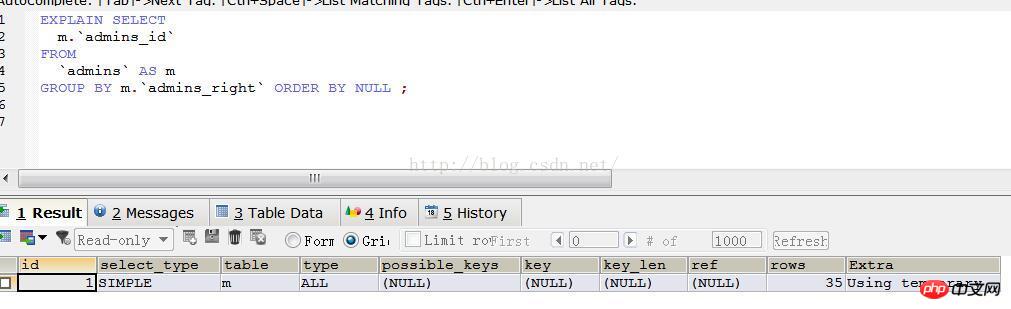
By default, using group by col1, col2.... will sort the query accordingly , if the user wants to avoid the consumption of sorted results, he can specify order by null to disable sorting. It can be seen from the extra field in the query results:

For query clauses containing or, if you want to use an index, each condition column between or must Indexes are used; otherwise, adding an index should be considered.
#The above is the detailed explanation of the steps of MySQL optimization. For more related content, please pay attention to PHP Chinese Net (www.php.cn)!


![[Web front-end] Node.js quick start](https://img.php.cn/upload/course/000/000/067/662b5d34ba7c0227.png)


