
 Web Front-end
H5 Tutorial
HTML5 Advanced Programming Graphic Distortion and Its Application 3 (Extended)
Web Front-end
H5 Tutorial
HTML5 Advanced Programming Graphic Distortion and Its Application 3 (Extended)
HTML5 Advanced Programming Graphic Distortion and Its Application 3 (Extended)

This article is the third in the series. The first two articles introduce the principle of achieving image distortion effect in HTML5, as well as the detailed usage of the drawtriangles function,
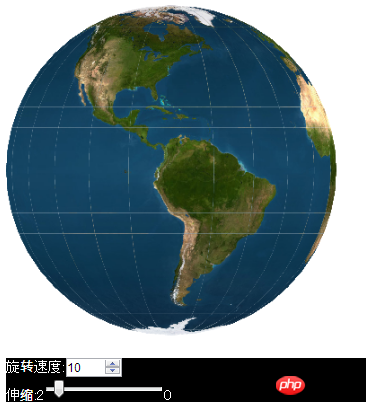
Let’s take a look at the extension of the drawtriangles function. Use the drawtriangles function to realize a rotated 3D Earth. The effect is as follows
Because there is a bug in the drawtriangles function of version 1.5.0 of lufylegend, I quietly updated version 1.5.1 of lufylegend. You can download it from the official website at the following address:
http: //lufylegend.com/lufylegend
In fact, to draw the 3D sphere effect, first draw a plane, then divide the plane into small triangles, and then use these small triangles to piece together a sphere.
Now, I first create a blank LBitmapData object, and then divide this object into N small triangles. For specific methods, see the code below
earthBitmapData = new LBitmapData("#ffffff", 0, 0, 500, 300);
var i, j;
vertices = new Array();
for(i=0;i<=cols;i++){
	for(j=0;j<=rows;j++){
		vertices.push(i*15,j*15);
	}
}
indices = new Array();
for (i = 0; i < cols; i++) {
	for (j = 0; j < rows; j++) {
		indices.push(i * (rows + 1) + j, (i + 1) * (rows + 1) + j, i * (rows + 1) + j + 1);
		indices.push((i + 1) * (rows + 1) + j, i * (rows + 1) + j + 1, (i + 1) * (rows + 1) + j + 1);
	}
}
uvtData = new Array();
for (i = 0; i <= cols; i++) {
	for (j = 0; j <= rows; j++) {
		uvtData.push(i / cols, j / rows);
	}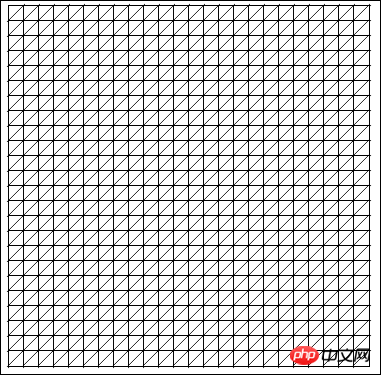
}Then, use the drawtriangles function to draw the LBitmapData object Go to the screen
backLayer = new LSprite();
addChild(backLayer);
backLayer.graphics.clear();
backLayer.graphics.beginBitmapFill(earthBitmapData);
backLayer.graphics.drawTriangles(vertices, indices, uvtData, 2);
and get the effect as shown below.
If you want to program this plane into a circle, you need to calculate the coordinates of each small triangle in the picture. Let's first look at how the y coordinate should be calculated. See The picture below is a vertical section of a ball
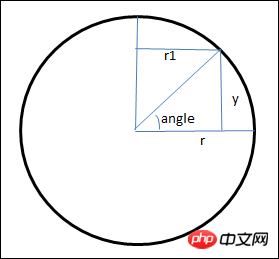
Use trigonometric functions to calculate the y coordinate in the picture and the horizontal section of the ball at the location of the y coordinate. The radius of the circle r1
var a = Math.sin(angle);
if((90-180*j/rows)%90==0 && (90-180*j/rows)%180!=0)a=(90-180*j/rows)>0?1:-1;
var y =  -r*a;
var sa = Math.cos(angle);
var r1 =  Math.abs(r*sa);
So, first bring the calculated y coordinate into the vertices array
for(i=0;i<=cols;i++){
	for(j=0;j<=rows;j++){
		var angle = (90-180*j/rows)*Math.PI/180;
		var a = Math.sin(angle);
		if((90-180*j/rows)%90==0 && (90-180*j/rows)%180!=0)a=(90-180*j/rows)>0?1:-1;
		if((90-180*j/rows)%180==0)a=0;
		var sy =  -r*a;
		vertices.push(i*15,sy);
	}
}Because the x coordinate has not been calculated yet, a special figure is obtained, as follows

Next, let’s see how the coordinate of x is calculated. First, take out the plane section with radius r1, as shown below
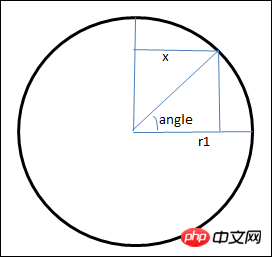
Use trigonometric functions to calculate the x coordinate in the graph
var b = Math.cos(angle*Math.PI/180);
var x =  r1*b;
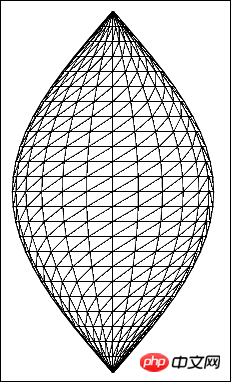
At this time, if only the calculated x coordinate is brought into the vertices array
for(i=0;i<=cols;i++){
	for(j=0;j<=rows;j++){
		var sa = Math.cos(angle);
		if((90-180*j/rows)%180==0)sa=1;
		var sr =  Math.abs(r*sa);
		var angle2 = 360*(i+1)/cols;
		var b = Math.cos(angle2*Math.PI/180);
		if(angle2%360==0)b=1;
		else if(angle2%180==0)b=-1;
		var sx =  sr*b;
		vertices.push(sx,j*15);
	}
}because The y coordinate is not calculated, so a very interesting graph is obtained, as follows
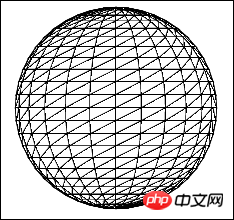
If the calculated x coordinate and y coordinate are brought into the vertices array at the same time If
for(i=0;i<=cols;i++){
	for(j=0;j<=rows;j++){
		var angle = (90-180*j/rows)*Math.PI/180;
		var a = Math.sin(angle);
		if((90-180*j/rows)%90==0 && (90-180*j/rows)%180!=0)a=(90-180*j/rows)>0?1:-1;
		if((90-180*j/rows)%180==0)a=0;
		var sy =  -r*a;
		var sa = Math.cos(angle);
		if((90-180*j/rows)%180==0)sa=1;
		var sr =  Math.abs(r*sa);
		var angle2 = 360*(i+1)/cols;
		var b = Math.cos(angle2*Math.PI/180);
		if(angle2%360==0)b=1;
		else if(angle2%180==0)b=-1;
		var sx =  sr*b;
		vertices.push(sx, sy);
	}
}, you will get a complete sphere graphic, as shown below
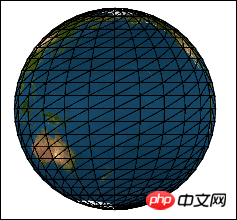
The next step is simple, replace the blank picture with the plane diagram of the earth, The code is as follows
earthBitmapData = new LBitmapData(imglist["earth"]);
Run the code again, you can get the following 3D graphics
Now, it’s time to let the earth rotate. According to As mentioned in the previous article, the elements in the uvtData array passed into the drawtriangles function are the relative positions of each small triangle in the original picture. They determine the starting position of drawing the picture. If a set of positions, such as 0123, is changed, the positions It becomes 1230, and then continues to transform into 2301. By continuously changing the position in this way, visually, the rotation has actually been realized. Then in the code, you only need to move the divided array according to each column, each time Move the two sets of triangles in the first column to the last column, so that the two sets of triangles in the second column become the first column, so that constant transformation can make an earth rotate
for (i = 0; i <= rows; i++) {
	uvtData.push(uvtData.shift());
	uvtData.push(uvtData.shift());
}If you want Changing the size of the earth is even simpler. Changing the scaleX and scaleY properties of the LSprite object can change its size. You can click on the link below to test its effect
http:/ /lufy.netne.net/lufylegend-js/3dearth/index.html
Remarks:
Once again, the content introduced in this article requires the support of version 1.5.1 or above of the HTML5 open source engine lufylegend. The release address of lufylegend version 1.5.1 is as follows
http://lufylegend.com /lufylegend
The above is the content of HTML5 Advanced Programming Graphic Distortion and Its Application III (Extension). For more related content, please pay attention to the PHP Chinese website (www.php.cn)!

Hot AI Tools

Undresser.AI Undress
AI-powered app for creating realistic nude photos

AI Clothes Remover
Online AI tool for removing clothes from photos.

Undress AI Tool
Undress images for free

Clothoff.io
AI clothes remover

AI Hentai Generator
Generate AI Hentai for free.

Hot Article
Hot Tools

Notepad++7.3.1
Easy-to-use and free code editor

SublimeText3 Chinese version
Chinese version, very easy to use

Zend Studio 13.0.1
Powerful PHP integrated development environment

Dreamweaver CS6
Visual web development tools

SublimeText3 Mac version
God-level code editing software (SublimeText3)
Hot Topics
 1385
1385
 52
52

 Table Border in HTML
Sep 04, 2024 pm 04:49 PM
Table Border in HTML
Sep 04, 2024 pm 04:49 PM
Guide to Table Border in HTML. Here we discuss multiple ways for defining table-border with examples of the Table Border in HTML.
 HTML margin-left
Sep 04, 2024 pm 04:48 PM
HTML margin-left
Sep 04, 2024 pm 04:48 PM
Guide to HTML margin-left. Here we discuss a brief overview on HTML margin-left and its Examples along with its Code Implementation.
 Nested Table in HTML
Sep 04, 2024 pm 04:49 PM
Nested Table in HTML
Sep 04, 2024 pm 04:49 PM
This is a guide to Nested Table in HTML. Here we discuss how to create a table within the table along with the respective examples.
 HTML Table Layout
Sep 04, 2024 pm 04:54 PM
HTML Table Layout
Sep 04, 2024 pm 04:54 PM
Guide to HTML Table Layout. Here we discuss the Values of HTML Table Layout along with the examples and outputs n detail.
 HTML Input Placeholder
Sep 04, 2024 pm 04:54 PM
HTML Input Placeholder
Sep 04, 2024 pm 04:54 PM
Guide to HTML Input Placeholder. Here we discuss the Examples of HTML Input Placeholder along with the codes and outputs.
 HTML Ordered List
Sep 04, 2024 pm 04:43 PM
HTML Ordered List
Sep 04, 2024 pm 04:43 PM
Guide to the HTML Ordered List. Here we also discuss introduction of HTML Ordered list and types along with their example respectively
 Moving Text in HTML
Sep 04, 2024 pm 04:45 PM
Moving Text in HTML
Sep 04, 2024 pm 04:45 PM
Guide to Moving Text in HTML. Here we discuss an introduction, how marquee tag work with syntax and examples to implement.
 HTML onclick Button
Sep 04, 2024 pm 04:49 PM
HTML onclick Button
Sep 04, 2024 pm 04:49 PM
Guide to HTML onclick Button. Here we discuss their introduction, working, examples and onclick Event in various events respectively.
