

Mysql analysis-awk+Threads analysis status

当我们想了解当前mysql连接情况,分析其运行状态,那该如何查看呢?
登录mysql数据库后,
show status();
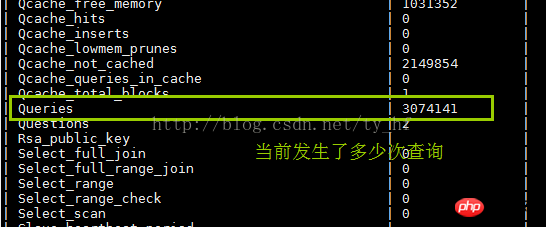
会发现其中有一向【query】
此query查询栏目,表示当前时间发生过的查询次数,要想知道一段时间的查询次数,查询两次做差即可。
当前query - 10分钟后的query = 此十分钟的查询数
再往下 有【Threads】相关栏目
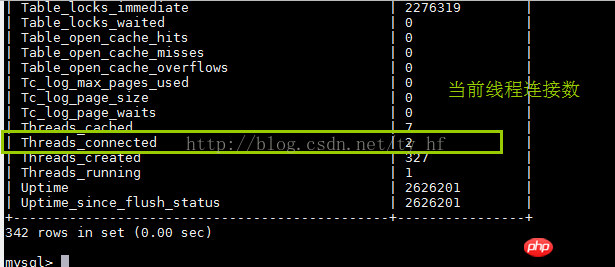
1.Threads_connected:当前线程连接个数
2.Threads_running: 当前进程运行个数
3.Threads_cached:已经被线程缓存池缓存的线程个数
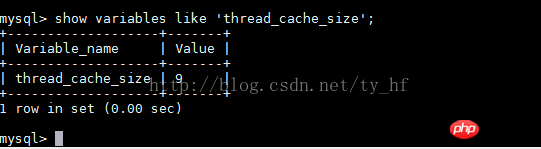
4.Threads_created:表示创建过的线程数,如果发现Threads_created值过大的话,表明MySQL服务器一直在创建线程,这也是比较耗资源,可以适当增加配置文件中thread_cache_size值
show variables like 'thread_cache_size';
AWK用法:
awk '/匹配正则/{printf("%d\n",$1)}' file_name.txt //匹配txt文件里的第一列($1)的信息
awk '正则/{处理方式}/正则/{处理方式}'
举例:
mysqladmin -uroot -p ext //效果等同于===>show status()
1.使用awk查询当前mysql查询条数:
mysqladmin -uroot -p ext |awk '/Queries/{printf("%d\n",$4)}'

mysqladmin -uroot -p ext |awk '/Queries/{a=$4}END{printf("%d",a)}' //另一种写法2.使用awk查询多条列的信息:
mysqladmin -uroot -p ext |awk '/Queries/{printf("%d\n",$4)}/Threads_connected/{printf("%d\n",$4)}/Threads_running/{printf("%d\n",$4)}'

mysqladmin -uroot -p ext |awk '/Queries/{a=$4}/Threads_connected/{b=$4}/Threads_running/{c=$4}END{printf("%d %d %d\n",a,b,c)}'
以上就是Mysql分析-awk+Threads分析状态 的内容,更多相关内容请关注PHP中文网(www.php.cn)!

Hot AI Tools

Undresser.AI Undress
AI-powered app for creating realistic nude photos

AI Clothes Remover
Online AI tool for removing clothes from photos.

Undress AI Tool
Undress images for free

Clothoff.io
AI clothes remover

Video Face Swap
Swap faces in any video effortlessly with our completely free AI face swap tool!

Hot Article
Hot Tools

Notepad++7.3.1
Easy-to-use and free code editor

SublimeText3 Chinese version
Chinese version, very easy to use

Zend Studio 13.0.1
Powerful PHP integrated development environment

Dreamweaver CS6
Visual web development tools

SublimeText3 Mac version
God-level code editing software (SublimeText3)
Hot Topics
 1387
1387
 52
52

 How to open phpmyadmin
Apr 10, 2025 pm 10:51 PM
How to open phpmyadmin
Apr 10, 2025 pm 10:51 PM
You can open phpMyAdmin through the following steps: 1. Log in to the website control panel; 2. Find and click the phpMyAdmin icon; 3. Enter MySQL credentials; 4. Click "Login".
 MySQL: An Introduction to the World's Most Popular Database
Apr 12, 2025 am 12:18 AM
MySQL: An Introduction to the World's Most Popular Database
Apr 12, 2025 am 12:18 AM
MySQL is an open source relational database management system, mainly used to store and retrieve data quickly and reliably. Its working principle includes client requests, query resolution, execution of queries and return results. Examples of usage include creating tables, inserting and querying data, and advanced features such as JOIN operations. Common errors involve SQL syntax, data types, and permissions, and optimization suggestions include the use of indexes, optimized queries, and partitioning of tables.
 How to use single threaded redis
Apr 10, 2025 pm 07:12 PM
How to use single threaded redis
Apr 10, 2025 pm 07:12 PM
Redis uses a single threaded architecture to provide high performance, simplicity, and consistency. It utilizes I/O multiplexing, event loops, non-blocking I/O, and shared memory to improve concurrency, but with limitations of concurrency limitations, single point of failure, and unsuitable for write-intensive workloads.
 Why Use MySQL? Benefits and Advantages
Apr 12, 2025 am 12:17 AM
Why Use MySQL? Benefits and Advantages
Apr 12, 2025 am 12:17 AM
MySQL is chosen for its performance, reliability, ease of use, and community support. 1.MySQL provides efficient data storage and retrieval functions, supporting multiple data types and advanced query operations. 2. Adopt client-server architecture and multiple storage engines to support transaction and query optimization. 3. Easy to use, supports a variety of operating systems and programming languages. 4. Have strong community support and provide rich resources and solutions.
 MySQL's Place: Databases and Programming
Apr 13, 2025 am 12:18 AM
MySQL's Place: Databases and Programming
Apr 13, 2025 am 12:18 AM
MySQL's position in databases and programming is very important. It is an open source relational database management system that is widely used in various application scenarios. 1) MySQL provides efficient data storage, organization and retrieval functions, supporting Web, mobile and enterprise-level systems. 2) It uses a client-server architecture, supports multiple storage engines and index optimization. 3) Basic usages include creating tables and inserting data, and advanced usages involve multi-table JOINs and complex queries. 4) Frequently asked questions such as SQL syntax errors and performance issues can be debugged through the EXPLAIN command and slow query log. 5) Performance optimization methods include rational use of indexes, optimized query and use of caches. Best practices include using transactions and PreparedStatemen
 Monitor Redis Droplet with Redis Exporter Service
Apr 10, 2025 pm 01:36 PM
Monitor Redis Droplet with Redis Exporter Service
Apr 10, 2025 pm 01:36 PM
Effective monitoring of Redis databases is critical to maintaining optimal performance, identifying potential bottlenecks, and ensuring overall system reliability. Redis Exporter Service is a powerful utility designed to monitor Redis databases using Prometheus. This tutorial will guide you through the complete setup and configuration of Redis Exporter Service, ensuring you seamlessly build monitoring solutions. By studying this tutorial, you will achieve fully operational monitoring settings
 How to view sql database error
Apr 10, 2025 pm 12:09 PM
How to view sql database error
Apr 10, 2025 pm 12:09 PM
The methods for viewing SQL database errors are: 1. View error messages directly; 2. Use SHOW ERRORS and SHOW WARNINGS commands; 3. Access the error log; 4. Use error codes to find the cause of the error; 5. Check the database connection and query syntax; 6. Use debugging tools.
 How to connect to the database of apache
Apr 13, 2025 pm 01:03 PM
How to connect to the database of apache
Apr 13, 2025 pm 01:03 PM
Apache connects to a database requires the following steps: Install the database driver. Configure the web.xml file to create a connection pool. Create a JDBC data source and specify the connection settings. Use the JDBC API to access the database from Java code, including getting connections, creating statements, binding parameters, executing queries or updates, and processing results.
