 Web Front-end
 JS Tutorial
 Detailed explanation of more than a dozen practical JavaScript debugging tips with pictures and codes
Detailed explanation of more than a dozen practical JavaScript debugging tips with pictures and codes
'debugger;'
In addition to console.log, debugger is another quick debugging tool that I like very much. After the debugger is added to the code, Chrome will automatically stop where it is inserted, much like breakpoints in C or Java. You can also insert this debugging statement in some conditional controls, for example:
if (thisThing) {
    debugger;
}Display Objects in table form
Sometimes we need to see the detailed information of some complex objects. The simplest The method is to use console.log and then display it in a list, scroll up and down to browse. However, it seems that it would be better to display it as a list using console.table, which probably looks like this:
var animals = [
    { animal: 'Horse', name: 'Henry', age: 43 },
    { animal: 'Dog', name: 'Fred', age: 13 },
    { animal: 'Cat', name: 'Frodo', age: 18 }
];

console.table(animals);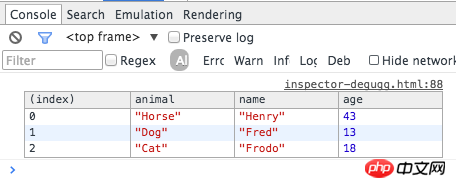
Multiple screen size test
Chrome has a very attractive feature that is able to simulate the sizes of different devices. Click the toggle device mode button in Chrome's Inspector, and then you can debug under different device screen sizes:

Quickly select a DOM element in the Console
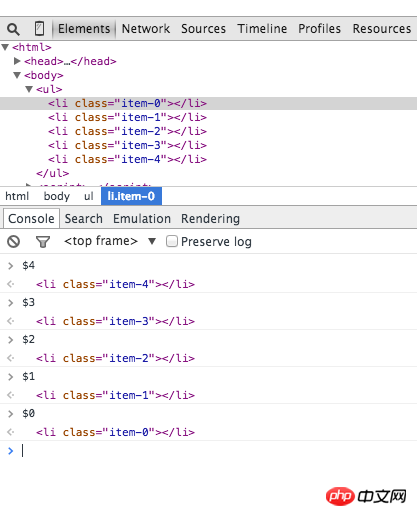
It is also a very common operation to select a DOM element in the Elements selection panel and then use the element in the Console. , Chrome Inspector will cache the last 5 DOM elements in its history. You can use methods similar to $0 in Shell to quickly associate to elements. For example, the list below has the elements 'item-4', 'item-3', 'item-2', 'item-1', 'item-0'. You can use it like this:
Get the call tracking record of a certain function
The JavaScript framework greatly facilitates our development, but it also brings a large number of predefined functions, such as creating View , binding events, etc., so that it is not easy for us to track the calling process of our custom functions. Although JavaScript is not a very rigorous language, sometimes it can be difficult to figure out what is going on, especially when you need to review other people's code. At this time console.trace will come into play, it can help you trace function calls. For example, in the following code, we need to trace the calling process of funcZ in the car object:
var car;

var func1 = function() {
func2();
}

var func2 = function() {
func4();
}

var func3 = function() {

}

var func4 = function() {
car = new Car();
car.funcX();
}

var Car = function() {
this.brand = ‘volvo’;
this.color = ‘red’;

this.funcX = function() {
this.funcY();
}

this.funcY = function() {
this.funcZ();
}

this.funcZ = function() {
console.trace(‘trace car’)
}
}

func1();Here you can clearly see that func1 calls func2, and then calls func4, and func4 creates an instance of Car and then car.funcX is called.
Format compressed code
Sometimes we find some inexplicable problems in the production environment, and then forget to put the sourcemaps on this server, or look at other people's homes When I looked at the source code of the website, I saw a bunch of code that I didn’t know what to say, like the picture below. Chrome provides us with a very user-friendly decompression tool to enhance the readability of the code. It can be used like this:

Quickly locate debugging functions
When we want to add a breakpoint in a function, we usually choose to do this:
Find the specified line in the Inspector, and then add a breakpoint
Add a debugger call in the script
However, there is a small problem with both methods, that is, you have to go to the corresponding script file and then find the corresponding line, so It will be more troublesome. Here is a relatively quick method, which is to use debug(funcName) in the console and the script will automatically stop at the place where the corresponding function is specified. A flaw of this method is that it cannot stop at a private function or anonymous function, so it still has to vary from time to time:
var func1 = function() {
func2();
};

var Car = function() {
this.funcX = function() {
this.funcY();
}

this.funcY = function() {
this.funcZ();
}
}

var car = new Car();
Prohibit unrelated scripts from running
When we develop modern web pages, we will use some third-party frameworks or libraries. Almost all of them have been tested and have relatively few bugs. However, when we debug our own scripts, we may accidentally jump into these files, causing additional debugging tasks. The solution is to prohibit these scripts that do not require debugging from running. For details, see this article: javascript-debugging-with-black-box.
在较复杂的调试情况下发现关键元素
在一些复杂的调试环境下我们可能要输出很多行的内容,这时候我们习惯性的会用console.log, console.debug, console.warn, console.info, console.error这些来进行区分,然后就可以在Inspector中进行过滤。不过有时候我们还是希望能够自定义显示样式,你可以用CSS来定义个性化的信息样式:
console.todo = function(msg) {
console.log(‘ % c % s % s % s‘, ‘color: yellow; background - color: black;’, ‘–‘, msg, ‘–‘);
}

console.important = function(msg) {
console.log(‘ % c % s % s % s’, ‘color: brown; font - weight: bold; text - decoration: underline;’, ‘–‘, msg, ‘–‘);
}

console.todo(“This is something that’ s need to be fixed”);
console.important(‘This is an important message’);
在console.log()中你可以使用%s来代表一个字符串 , %i 来代表数字, 以及 %c 来代表自定义的样式。
监测指定函数的调用与参数
在Chrome中可以监测指定函数的调用情况以及参数:
var func1 = function(x, y, z) {
};
这种方式能够让你实时监控到底啥参数被传入到了指定函数中。
Console中使用$进行元素查询
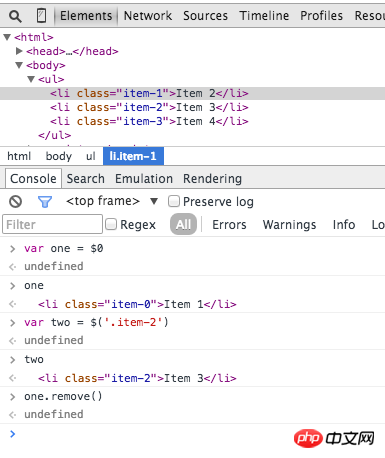
在Console中也可以使用来进行类似于querySelector那样基于CSS选择器的查询,(‘css-selector’) 会返回满足匹配的第一个元素,而$$(‘css-selector’) 会返回全部匹配元素。注意,如果你会多次使用到元素,那么别忘了将它们存入变量中。
Postman
很多人习惯用Postman进行API调试或者发起Ajax请求,不过别忘了你浏览器自带的也能做这个,并且你也不需要担心啥认证啊这些,因为Cookie都是自带帮你传送的,这些只要在network这个tab里就能进行,大概这样子:

DOM变化检测
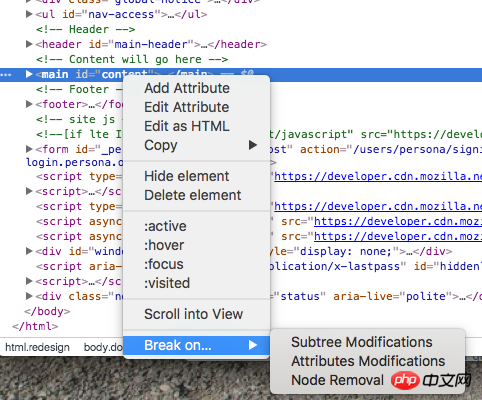
DOM有时候还是很操蛋的,有时候压根不知道啥时候就变了,不过Chrome提供了一个小的功能就是当DOM发生变化的时候它会提醒你,你可以监测属性变化等等:
以上就是关于十几个 实用的 JavaScript 调试小技巧图文代码详解的内容,更多相关内容请关注PHP中文网(www.php.cn)!

Hot AI Tools

Undresser.AI Undress
AI-powered app for creating realistic nude photos

AI Clothes Remover
Online AI tool for removing clothes from photos.

Undress AI Tool
Undress images for free

Clothoff.io
AI clothes remover

AI Hentai Generator
Generate AI Hentai for free.

Hot Article

Hot Tools

Notepad++7.3.1
Easy-to-use and free code editor

SublimeText3 Chinese version
Chinese version, very easy to use

Zend Studio 13.0.1
Powerful PHP integrated development environment

Dreamweaver CS6
Visual web development tools

SublimeText3 Mac version
God-level code editing software (SublimeText3)

Hot Topics
 How to implement an online speech recognition system using WebSocket and JavaScript
Dec 17, 2023 pm 02:54 PM
How to use WebSocket and JavaScript to implement an online speech recognition system Introduction: With the continuous development of technology, speech recognition technology has become an important part of the field of artificial intelligence. The online speech recognition system based on WebSocket and JavaScript has the characteristics of low latency, real-time and cross-platform, and has become a widely used solution. This article will introduce how to use WebSocket and JavaScript to implement an online speech recognition system.
 WebSocket and JavaScript: key technologies for implementing real-time monitoring systems
Dec 17, 2023 pm 05:30 PM
WebSocket and JavaScript: Key technologies for realizing real-time monitoring systems Introduction: With the rapid development of Internet technology, real-time monitoring systems have been widely used in various fields. One of the key technologies to achieve real-time monitoring is the combination of WebSocket and JavaScript. This article will introduce the application of WebSocket and JavaScript in real-time monitoring systems, give code examples, and explain their implementation principles in detail. 1. WebSocket technology
 How to implement an online reservation system using WebSocket and JavaScript
Dec 17, 2023 am 09:39 AM
How to use WebSocket and JavaScript to implement an online reservation system. In today's digital era, more and more businesses and services need to provide online reservation functions. It is crucial to implement an efficient and real-time online reservation system. This article will introduce how to use WebSocket and JavaScript to implement an online reservation system, and provide specific code examples. 1. What is WebSocket? WebSocket is a full-duplex method on a single TCP connection.
 How to use JavaScript and WebSocket to implement a real-time online ordering system
Dec 17, 2023 pm 12:09 PM
Introduction to how to use JavaScript and WebSocket to implement a real-time online ordering system: With the popularity of the Internet and the advancement of technology, more and more restaurants have begun to provide online ordering services. In order to implement a real-time online ordering system, we can use JavaScript and WebSocket technology. WebSocket is a full-duplex communication protocol based on the TCP protocol, which can realize real-time two-way communication between the client and the server. In the real-time online ordering system, when the user selects dishes and places an order
 JavaScript and WebSocket: Building an efficient real-time weather forecasting system
Dec 17, 2023 pm 05:13 PM
JavaScript and WebSocket: Building an efficient real-time weather forecast system Introduction: Today, the accuracy of weather forecasts is of great significance to daily life and decision-making. As technology develops, we can provide more accurate and reliable weather forecasts by obtaining weather data in real time. In this article, we will learn how to use JavaScript and WebSocket technology to build an efficient real-time weather forecast system. This article will demonstrate the implementation process through specific code examples. We
 Simple JavaScript Tutorial: How to Get HTTP Status Code
Jan 05, 2024 pm 06:08 PM
JavaScript tutorial: How to get HTTP status code, specific code examples are required. Preface: In web development, data interaction with the server is often involved. When communicating with the server, we often need to obtain the returned HTTP status code to determine whether the operation is successful, and perform corresponding processing based on different status codes. This article will teach you how to use JavaScript to obtain HTTP status codes and provide some practical code examples. Using XMLHttpRequest
 How to use insertBefore in javascript
Nov 24, 2023 am 11:56 AM
Usage: In JavaScript, the insertBefore() method is used to insert a new node in the DOM tree. This method requires two parameters: the new node to be inserted and the reference node (that is, the node where the new node will be inserted).
 How to get HTTP status code in JavaScript the easy way
Jan 05, 2024 pm 01:37 PM
Introduction to the method of obtaining HTTP status code in JavaScript: In front-end development, we often need to deal with the interaction with the back-end interface, and HTTP status code is a very important part of it. Understanding and obtaining HTTP status codes helps us better handle the data returned by the interface. This article will introduce how to use JavaScript to obtain HTTP status codes and provide specific code examples. 1. What is HTTP status code? HTTP status code means that when the browser initiates a request to the server, the service


