Questions you need to think about
Generally speaking, when you think you have encountered a memory leak problem, you need to think about three questions:
Does my page take up too much memory? - Timeline memory view tool (Timeline memory view) and Chrome task manager (Chrome task manager) can help you confirm whether you have used More memory. Memory view can track the DOM node count, documents document count and JSeventlistening count during page rendering. As a rule of thumb: avoid references to DOM elements you no longer need, remove unnecessary event listeners and be careful when storing large chunks of data that you may not use.
Does my page have a memory leak? - ObjectAllocation Tracking(Object allocation tracker) helps you locate leaks by viewing the allocation of JS objects in real time. You can also use the heap analyzer (Heap Profiler) to generate a JS heap snapshot, and find out the objects that have not been cleaned up by garbage collection by analyzing the memory map and comparing the differences between the snapshots.
How often is my page garbage collection forced? - If your page garbage collection is very frequent, it means that your page may be allocated too frequently. . Timeline memory view can help you find pauses of interest.
Basic concepts
This section introducesmemory analysis Common terms used in memory analysis tools for other languages. The terms and concepts here are used in the Heap Profiler UI tool and related documentation.
These can help us become familiar with how to effectively use memory analysis tools. If you have ever used memory analysis tools for languages like Java, .NET, etc., then this will be areview.
Object sizesThink of memory as a collection of basic types (like numbers andstrings) and objects (associative arrays ) chart. It might look something like the following diagram of a series of related points.

- The object itself uses directly
- Implicitly maintain references to other objects. This method will prevent garbage collection (GC) from automatically recycling those objects.
Direct memory occupation (Shallow Size) and Total memory occupation (Retained Size) , so what do they mean?
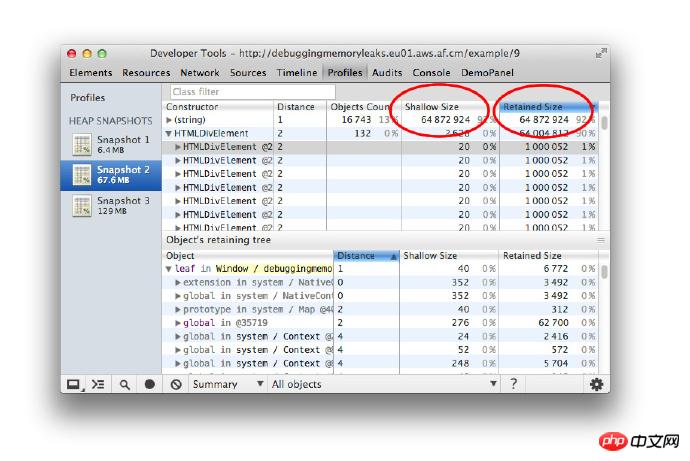
Directly occupy memory (Shallow Size, excluding the memory occupied by the referenced object)
This is the memory occupied by the object itself.
A typical JavaScript object will have reserved memory to describe the object and store its direct value. Generally, only arrays and strings will significantly occupy memory directly (Shallow Size). But strings and arrays often store the main data portion in renderer memory, only exposing a small wrapper object in the JavaScript object stack.
Renderer memory refers to all the memory used in the rendering process of the page you analyze: the memory of the page itself + the memory used by the JS heap in the page + the related worker processes (workers) triggered by the page The memory used by the JS heap. However, a small object may indirectly occupy a large amount of memory by preventing other objects from being automatically collected by the garbage.
Total memory occupied (Retained Size, including the memory occupied by the referenced object)
Once an object is deleted, the dependent objects it refers to cannot be ## When #GC root (GC root) is referenced, the memory occupied by them will be released. The total memory occupied by an object includes the memory occupied by these dependent objects.
GC root is composed of controllers(handles). These controllers (whether local or global) is created when establishing a reference from the build-infunction(native code) to a JavaScript object outside the V8 engine. All of these controllers have access to the GC roots(GC roots) > Handle scope and GC roots >Global handlers## of the heap snapshot Found in #. Introducing these controllers in this article may be confusing without a deep understanding of browser implementation. You don't need to worry too much about GC roots and controllers. There are many internal GC roots that are unimportant to users. From an application perspective, there are the following situations:
- Window global object (all in
- if
rame). There is a distance field in the heap snapshot, which is the shortest path length from the window object to the corresponding object.
The document DOM tree consists of all DOM nodes that the document can traverse. Not all nodes will be referenced by the corresponding JS, but the nodes referenced by JS will be retained as long as the document exists. - There are many objects that may be created when
- debugging
code or in the DevTools console (for example: after some code in the console is executed).
We recommend that users do not execute code in the console or enable debugging breakpoints when creating heap snapshots. The memory map starts with a root, which may be the browser's
window object or the Node.jsmoduleGlobal object. How these objects are reclaimed from memory is not under the user's control.
 Objects that cannot be traversed by the GC root will be memory recycled.
The data in the directly occupied memory and total memory occupied fields are expressed in bytes. Total memory tree occupied by objects
We have learned before that the heap is a network structure composed of various interrelated objects. In the digital world, this structure is called a graph or memory graph. The graph is composed of
nodesconnected by edges, and they are all labeled.
Nodes- (
- or object
) The label names of nodes are determined by the constructor## that created them. #Determine the name of the functionEdges
The tag name is Attribute - Name
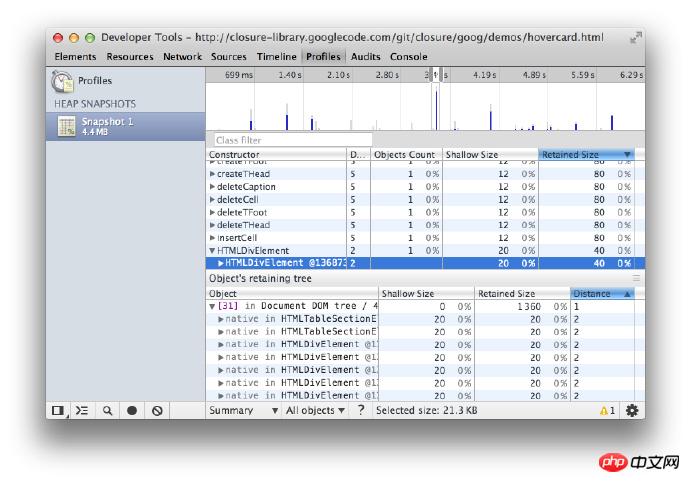
## Later in this document you will learn how to use the Heap Analyzer to generate snapshots. From the snapshot generated by the heap analyzer in the figure below, we can see the distance field: it refers to the distance from the object to the GC root. If all objects of the same type are at the same distance, but a small subset are farther apart, there may be something wrong that you need to investigate.
Node 1 dominates Node 2
Node 2 dominates nodes 3, 4 and 6
node 3 dominates node 5
node 5 dominates node 8
Node 6 dominates node 7
Numbers (such as 3.14159..)
Booleans (true or false)
Character type (Strings) (such as 'Werner Heisenberg')
31-bit Integersdirect values, Called: small integers (small integers)(SMIs), or
heap objects, referenced as Heap value. Heap values are used to store data that are not suitable for SMI storage, such as double numbers, or when a value needs to be boxed, such as this value and then set the attribute value.
VM heap, Or
external renderer memory. At this time, a wrapper object is created to access the storage location, such as script resources and other content stored in the web page package, instead of being copied directly to the VM heap.
named properties, and
Number elements
-
Total memory used – Has memory usage increased?
Number of DOM nodes
Number of documents
Number of registered event listeners
Summary (Summary) - Display objects by constructor name classification;
Comparison - Display the differences between objects between two snapshots;
Containment - Can be used to detect the contents of the heap;
a:property - an ordinary property indexed by the name , represented by .(dot )operator, or [] (square bracket) reference, such as ["foo bar"];
- 0:element
- Pass Ordinary properties with numerical indexes, referenced by [] (square brackets);
- a:context var
- properties within a function, within the function context, by name Quote;
- a:system prop
- A property added by the JavaScript VM and cannot be accessed by JavaScript code.
The object named Constructor(constructor) means all The number of instances of the object
created by this constructor is displayed in the Objects Count column
-
Shallow sizeThe column shows the total number of shallow sizes (directly occupying memory) of the object generated by the corresponding constructor
Retained size The column shows the maximum memory occupied by the corresponding object
DistanceThe column shows the shortest distance from the object to the GC root
Take a heap snapshot before the operation;
Perform an operation (do the action you think will cause a leak);
Undo the previous operation (reverse the previous operation and repeat it several times);
Take a second snapshot and switch the view to the control view. And compare with snapshot 1.
-
DOMWindow Objects - These objects are the "global" objects for JavaScript code;
GC root - The real GC root of the VM's garbage collector;
Native object - Browse The object is "pushed" into the JavaScript virtual machine to perform automatic operations, such as: DOM nodes, CSS rules (details will be introduced in the next section.)
Dominators
Dominator objects are like a tree structure because each object has a Dominator. The controller of an object may not directly refer to the object it dominates, that is, the dominated object tree structure is not a spanning tree in the graph.

In the above diagram:
In the example below, node #3 is the dominant node of #10, but #7 also appears in every path from GC to #10. Like this, if the B object appears in every path from the root node to the A object, then the B object is the dominant object of the A object.

V8 Introduction
In this section, we will describe some memory-related concepts that are related to the V8 JavaScript Virtual Machine (V8 VM or VM) related. When analyzing memory, it is helpful to understand these concepts in order to understand heap snapshots.
JavaScript Object Description
There are three primitive types:
They will not reference other values, they will only be leaf nodes or terminal nodes.
Numbers are stored in one of two ways:
Character typeData will be stored in the following two ways:
Newly created JavaScript objects will be allocated memory on the JavaScript heap (or VM heap). These objects are managed by V8's garbage collector and will remain in memory as long as there is a strong reference to them.
Local objects are all objects that are not in the JavaScript heap. Unlike heap objects, they will not be garbage collected by V8 during their lifecycle The handler can only wrap object references through JavaScript.
Connection string is an object formed by merging a pair of strings, and is the result of the merging. Connection stringsMerge only when necessary. Like a concatenated string substring needs to be constructed.
For example: if you connect a and b, you get the string (a, b) which is used to represent the result of the connection. If you later concatenate this result with d, you get another concatenation string ((a, b), d).
Array (Arrays) - Array is an object with numeric keys. They are widely used in the V8 engine when storing large amounts of data. Objects with key-value pairs like dictionaries are implemented using arrays.
A typical JavaScript object can be stored in one of two array types:
If there are only a few properties, they will be stored directly in the JavaScript object itself.
Map - An object used to describe an object type and its structure. For example, maps will be used to describe the structure of objects to achieve quick access to object properties
Object Group
Each local object group is composed of a group of interrelated objects of. For example, in a DOM subtree, each node can access its parent element, the next child element, and the next sibling element, which form an association graph. Note that native elements are not represented in the JavaScript heap - that's why their size is zero while their wrapping object is created.
Each wrapper object will have a reference to a local object, which is used to pass operations on these local objects. These local objects also have references to the wrapped objects. But this does not create an irrecoverable cycle, the GC is smart enough to identify local objects that no longer refer to the wrapped object and release them. But if a wrapper object is not released, it will retain all object groups and related wrapper objects.
Prerequisites and Helpful Tips
Chrome Task Manager
Note: When using Chrome for memory profiling, it is best to set up a clean test Environment
Open Chrome's memory manager, observe the memory field, and perform related operations on a page. You can quickly determine whether this operation will cause the page to occupy a lot of memory. You can find Memory Manager from Chrome Menu > Tools or by pressing Shift + Esc.

After opening, right-click on the header and select the memory used by JavasScript item.
Locate memory problems through DevTools Timeline
The first step in solving the problem is to be able to prove that the problem exists. This requires creating a reproducible test that serves as a baseline measure of the problem. Without reproducible procedures, the problem cannot be measured reliably. In other words, without a baseline for comparison, there is no way to know what changes caused the problem.
Timeline panelIt is very helpful to find when there is a problem with the program. It shows the moments when your web application or website is loading and interacting. All events: from loading resources to decoding JavaScript, style calculations, garbage collection pauses and page repaints. All are represented on the timeline.
When analyzing memory problems, the MemoryView(Memory view) on the timeline panel can be used to observe:

More about locating memory during memory analysis For leaks, see Zack Grossbart's Memory profiling with the Chrome DevTools
Proving the existence of a problem
The first thing to do is to find out what you think may be causing the problem Some actions for memory leaks. This can be any event that occurs on the page, including mouseovers, clicks, or other interactions that may cause performance degradation on the page.
Start recording in the timeline panel (Ctrl+E or Cmd+E) and then make the action you want to test. To force garbage collection, click the trash can icon ( ) on the panel.
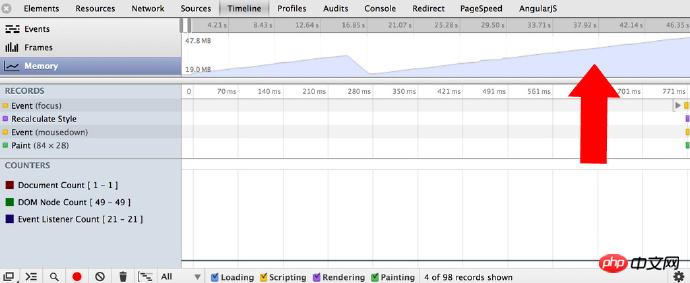
Here is an example of a memory leak where some points are not garbage collected:

If after some repeated testing, you see jagged The graphic (above the memory panel) indicates that there are many short-lived objects in your program. And if a series of actions do not keep the memory within a certain range, and the number of DOM nodes does not return to the number at the beginning, you can suspect a memory leak.

Once you have determined that there is a memory problem, you can use the heap analyzer on the Profiles panel profiler) to locate the source of the problem.
Example: Try the memory growth example, which can help you effectively Practiceanalyze memory problems through the timeline.
Memory Recycling
The memory collector (like in V8) needs to be able to locate which objects are live(live), and which objects are The object that is dead(garbage) is unreferenceable(unreachable).
If Garbage Collection (GC) fails to collect garbage objects due to logic errors in JavaScript execution, these garbage objects can no longer be recycled. Situations like this will eventually make your application slower and slower.
For example, when you are writing code, some variables and event listeners are no longer used, but they are still referenced by some codes. As long as the reference still exists, the referenced object cannot be correctly recycled by GC.
While your application is running, some DOM objects may have been updated/removed. Remember to check for variables that reference DOM objects and set them ##null. Check object properties that may reference other objects (or other DOM elements). Keep an eye on the variablescaching that may grow more and more.
Heap Analyzer
Take a Snapshot
In the Profiles panel, select Take Heap Snapshot and click Start or Press Cmd + E or Ctrl + E:

#The snapshot is initially saved in the renderer process memory. They are imported into DevTools on demand and you can see them when you click the Snapshotbutton. When a snapshot is loaded into DevTools and displayed, the number below the snapshot title shows the total amount of memory occupied by reachable JavaScript objects.

Example: Try the example of garbage collection in action and monitor memory usage in the Timeline panel.
Clear snapshots
Click Clear allbutton icon( ) to clear all snapshots:

Note: Close the DevTools window does not delete the collected snapshots from the rendering memory. When DevTools is reopened, the previous snapshot list is still there.
Remember what we mentioned before, you can force GC in DevTools when you take a snapshot. When we take a snapshot, GC is executed automatically. You can easily perform garbage collection by clicking the trash can (garbage collection) button ( ) in the Timeline.

Example: Try scattered objects and analyze it with Heap Profiler. You can see the collection of (object) items.
Switch snapshot view
A snapshot can switch views according to different tasks. You can switch through the selection box as shown in the figure:

The following are three default views:
##DominatorsThe view can be opened in the Settings panel - displays the dominators tree. It can be used to find memory growth points.
Distinguish objects through different colorsThe attributes and attribute values of objects have different types and are automatically distinguished by color. Each property is one of the following four: has no corresponding JavaScript type. They are built into the JavaScript VM object system. V8 places most built-in objects and user JS objects in the same heap. But they are just V8's internal objects. View details
Summary view
Open a snapshot, which is displayed in summary view by default. It displays the total number of objects and can be expanded to display specific content: Initially , a snapshot opens in the Summary view,
displaying object totals, which can be expanded to show instances: The first level is the "overall" row, they show: After expanding an overall row, all object instances will be displayed. The direct memory occupied and the total memory occupied by each instance are displayed accordingly. The number after the @ symbol is the unique ID of the object. With it, you can compare between different snapshots on an object-by-object basis. Example: Try this example (opens in a new tab) to learn how to use the summary view. Remember that yellow objects are referenced by JavaScript, while red objects are referenced by detached nodes with a yellow background color. This view is used to compare different snapshots to find the differences between snapshots and to find objects with memory leaks. To prove that a certain operation of the application does not cause leakage (for example: generally a pair of operations and undo actions, such as opening a document and then closing it, will not cause leakage), you can try the following steps: In comparison view, the differences between the two snapshots will be displayed. When a general category is expanded, added and deleted objects are displayed: Example: Try the example (open in a new tab) to learn how to use it Check views to locate memory leaks. The control view can be called a “bird’s eye view” of your application’s object structure. It allows you to look inside functions, just like your JavaScript objects, inside VM objects, giving you a very low-level view of memory usage in your application. This view provides several entry points: The following figure is a typical Control view: Example: Try the example (open in a new tab) to see how to use a control view to see internals and## of closures ##Event handling. It can be helpful to name your functions to help you differentiate between closure functions in a snapshot. For example: the following example does not name the function: 
Comparison view

Containment view

function createLargeClosure() {
  var largeStr = new Array(1000000).join('x');

  var lC = function() { // this is NOT a named function
    return largeStr;
  };

  return lC;
}


 Example: Try this example why eval is evil to analyze the impact of closures in memory. You may also be interested in trying the following example of logging heap allocations.


