
 Database
Mysql Tutorial
Detailed explanation of the code for collecting table information while monitoring MySQL (pictures and text)
Database
Mysql Tutorial
Detailed explanation of the code for collecting table information while monitoring MySQL (pictures and text)
Detailed explanation of the code for collecting table information while monitoring MySQL (pictures and text)

1. Story
Perhaps you are often asked about the monthly data volume growth of a certain table in the library in the past year. Of course, if you have tables divided by month, it is easier to handle. show table status one by one. If there is only one big table, then you probably have to run SQL statistics in the lonely night when everyone is resting, because you Only the current table information can be obtained, and historical information cannot be traced.
In addition, as a DBA, you must also estimate the growth of database space to plan capacity. The table information we are talking about mainly includes:
Table data size (DATA_LENGTH)
Index size (INDEX_LENGTH)
Number of rows (ROWS)
Current auto-increment value (AUTO_INCREMENT, if any)
I haven’t seen which one yetmysqlMonitoring tools provide such indicators. This information does not need to be collected too frequently, and the result is only an estimate and may not be accurate, so this is to monitor (collect) the table from a global and long-term perspective.
The collection tool I wrote to introduce in this article is based on the existing monitoring system in the group:
InfluxDB: Time series Database, stores monitoring dataGrafana: Data display panelTelegraf: Collect information The agent
took a look at the latest mysql plug-in of telegraf. I was very pleased at first: it supports the collection of Table schema statistics and Info schema auto increment columns. I tried it out and there is data, but as mentioned before, except for the self-increased value, everything else is an estimate. It is meaningless if telegraf collects too frequently. Maybe 2 times a day is enough. TheIntervalSlow## it provides #The option is hard-coded and can only slow down the frequency of global status monitoring. However, it can be implemented by separating it from other monitoring indicators into twoconfiguration files and defining the collection intervals respectively.
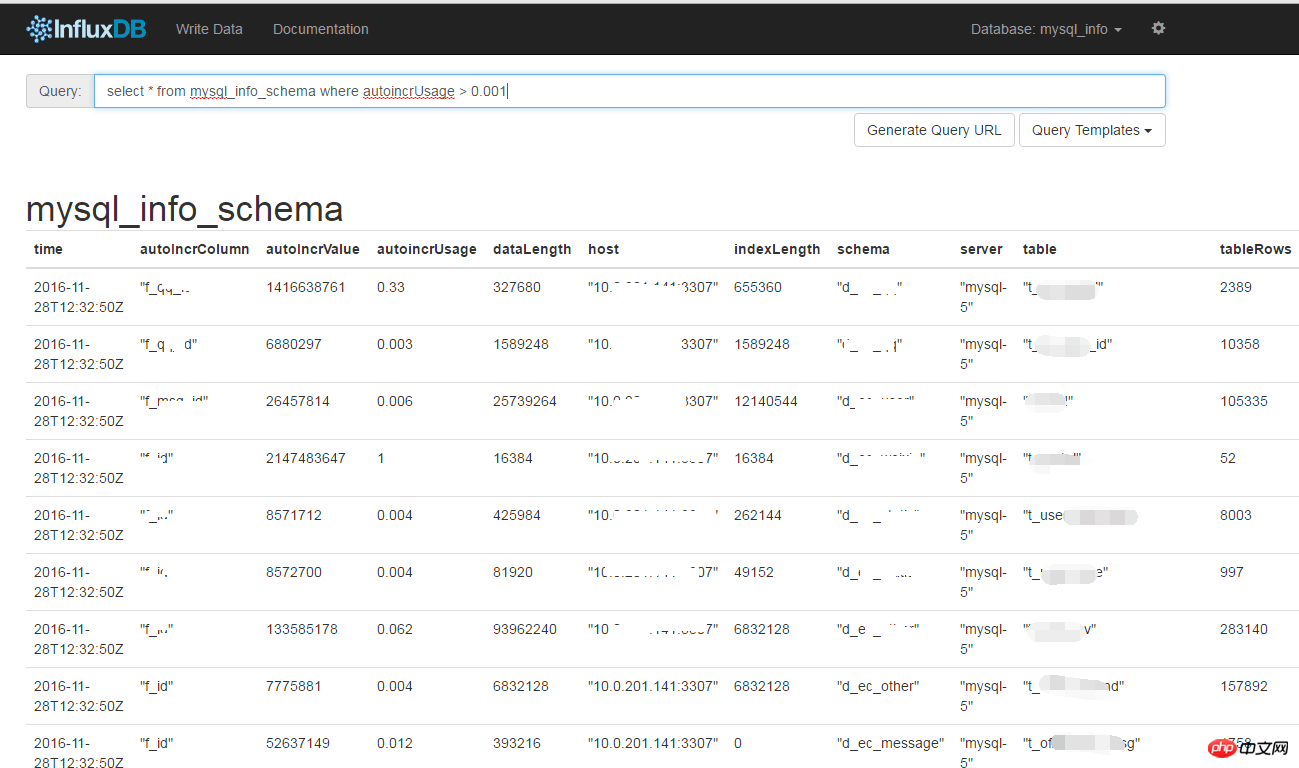
The implementation is also very simple, just query the
COLUMNS and TABLES two tables of the information_schema library:
SELECT
    IFNULL(@@hostname, @@server_id) SERVER_NAME,
    %s as HOST,
    t.TABLE_SCHEMA,
    t.TABLE_NAME,
    t.TABLE_ROWS,
    t.DATA_LENGTH,
    t.INDEX_LENGTH,
    t.AUTO_INCREMENT,
  c.COLUMN_NAME,
  c.DATA_TYPE,
  LOCATE('unsigned', c.COLUMN_TYPE) COL_UNSIGNED
  # CONCAT(c.DATA_TYPE, IF(LOCATE('unsigned', c.COLUMN_TYPE)=0, '', '_unsigned'))
FROM
    information_schema.`TABLES` t
LEFT JOIN information_schema.`COLUMNS` c ON t.TABLE_SCHEMA = c.TABLE_SCHEMA
AND t.TABLE_NAME = c.TABLE_NAME
AND c.EXTRA = 'auto_increment'
WHERE
    t.TABLE_SCHEMA NOT IN (
        'mysql',
        'information_schema',
        'performance_schema',
        'sys'
    )
AND t.TABLE_TYPE = 'BASE TABLE'auto_increment, in addition to paying attention to where the current growth is, we also care about how much free space is compared to the maximum value of int / bigint. So the autoIncrUsage column was calculated to save the currently used ratio.
json - this is a format commonly supported by monitoring tools such as Zabbix and Open-Falcon.
The last step is to use Grafana to draw pictures from the influxdb data source. 3. Usage- Environment
Written in python 2.7 environment, 2.6 and 3.x have not been tested.
MySQLdb and influxdb:
$ sudo pip install mysql-python influxdb
- Configuration
settings_dbs.pyConfiguration file - ##DBLIST_INFO
: List Store the MySQL instance table information that needs to be collected. The tuples are the connection address, port, user name, and password.
Users need the permission to select the table, otherwise they cannot see the corresponding information.
- InfluxDB_INFO
: Influxdb connection information, please create the database name in advance
mysql_infois set toNone
The output result is json. Create the database and storage strategy on influxdb - Storage for 2 years, 1 replica set: (Adjust as needed)
Look at the big information similar to:CREATE DATABASE "mysql_info" CREATE RETENTION POLICY "mysql_info_schema" ON "mysql_info" DURATION 730d REPLICATION 1 DEFAULT
Copy after login - It can be placed separately on the server used for monitoring, but it is recommended to be used in production The environment can be run on the host where the mysql instance is located, for safety reasons.
In the case of sub-database and table, the global unique ID cannot be calculated in the table autoIncrUsage
It is actually very difficult to implement Simple, the more important thing is to awaken the awareness of collecting this information
You can add Graphite output format
- Put crontab to run
before and after migration to collect it. Not recommended too often. <div class="code" style="position:relative; padding:0px; margin:0px;"><pre class='brush:php;toolbar:false;'>40 23,5,12,18 * * * /opt/DBschema_info/mysql_schema_info.py >> /tmp/collect_DBschema_info.log 2>&1</pre><div class="contentsignin">Copy after login</div></div>
- Table data size and number of rows
##Increment in the number of rows per day, auto_increment usage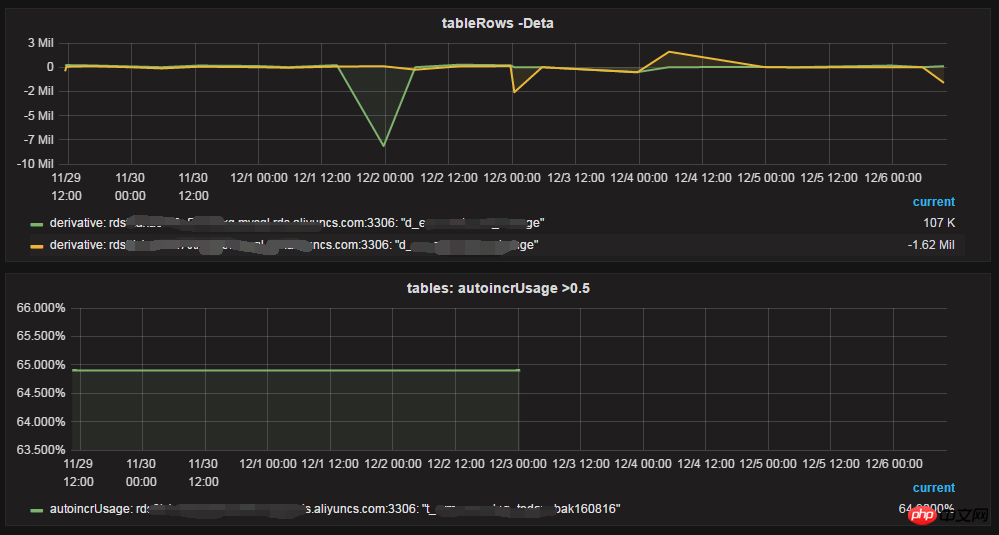
4. More
The above is the detailed content of Detailed explanation of the code for collecting table information while monitoring MySQL (pictures and text). For more information, please follow other related articles on the PHP Chinese website!

Hot AI Tools

Undresser.AI Undress
AI-powered app for creating realistic nude photos

AI Clothes Remover
Online AI tool for removing clothes from photos.

Undress AI Tool
Undress images for free

Clothoff.io
AI clothes remover

Video Face Swap
Swap faces in any video effortlessly with our completely free AI face swap tool!

Hot Article
Hot Tools

Notepad++7.3.1
Easy-to-use and free code editor

SublimeText3 Chinese version
Chinese version, very easy to use

Zend Studio 13.0.1
Powerful PHP integrated development environment

Dreamweaver CS6
Visual web development tools

SublimeText3 Mac version
God-level code editing software (SublimeText3)
Hot Topics
 1386
1386
 52
52

 MySQL: Simple Concepts for Easy Learning
Apr 10, 2025 am 09:29 AM
MySQL: Simple Concepts for Easy Learning
Apr 10, 2025 am 09:29 AM
MySQL is an open source relational database management system. 1) Create database and tables: Use the CREATEDATABASE and CREATETABLE commands. 2) Basic operations: INSERT, UPDATE, DELETE and SELECT. 3) Advanced operations: JOIN, subquery and transaction processing. 4) Debugging skills: Check syntax, data type and permissions. 5) Optimization suggestions: Use indexes, avoid SELECT* and use transactions.
 How to open phpmyadmin
Apr 10, 2025 pm 10:51 PM
How to open phpmyadmin
Apr 10, 2025 pm 10:51 PM
You can open phpMyAdmin through the following steps: 1. Log in to the website control panel; 2. Find and click the phpMyAdmin icon; 3. Enter MySQL credentials; 4. Click "Login".
 MySQL: An Introduction to the World's Most Popular Database
Apr 12, 2025 am 12:18 AM
MySQL: An Introduction to the World's Most Popular Database
Apr 12, 2025 am 12:18 AM
MySQL is an open source relational database management system, mainly used to store and retrieve data quickly and reliably. Its working principle includes client requests, query resolution, execution of queries and return results. Examples of usage include creating tables, inserting and querying data, and advanced features such as JOIN operations. Common errors involve SQL syntax, data types, and permissions, and optimization suggestions include the use of indexes, optimized queries, and partitioning of tables.
 How to use single threaded redis
Apr 10, 2025 pm 07:12 PM
How to use single threaded redis
Apr 10, 2025 pm 07:12 PM
Redis uses a single threaded architecture to provide high performance, simplicity, and consistency. It utilizes I/O multiplexing, event loops, non-blocking I/O, and shared memory to improve concurrency, but with limitations of concurrency limitations, single point of failure, and unsuitable for write-intensive workloads.
 Why Use MySQL? Benefits and Advantages
Apr 12, 2025 am 12:17 AM
Why Use MySQL? Benefits and Advantages
Apr 12, 2025 am 12:17 AM
MySQL is chosen for its performance, reliability, ease of use, and community support. 1.MySQL provides efficient data storage and retrieval functions, supporting multiple data types and advanced query operations. 2. Adopt client-server architecture and multiple storage engines to support transaction and query optimization. 3. Easy to use, supports a variety of operating systems and programming languages. 4. Have strong community support and provide rich resources and solutions.
 MySQL's Place: Databases and Programming
Apr 13, 2025 am 12:18 AM
MySQL's Place: Databases and Programming
Apr 13, 2025 am 12:18 AM
MySQL's position in databases and programming is very important. It is an open source relational database management system that is widely used in various application scenarios. 1) MySQL provides efficient data storage, organization and retrieval functions, supporting Web, mobile and enterprise-level systems. 2) It uses a client-server architecture, supports multiple storage engines and index optimization. 3) Basic usages include creating tables and inserting data, and advanced usages involve multi-table JOINs and complex queries. 4) Frequently asked questions such as SQL syntax errors and performance issues can be debugged through the EXPLAIN command and slow query log. 5) Performance optimization methods include rational use of indexes, optimized query and use of caches. Best practices include using transactions and PreparedStatemen
 MySQL and SQL: Essential Skills for Developers
Apr 10, 2025 am 09:30 AM
MySQL and SQL: Essential Skills for Developers
Apr 10, 2025 am 09:30 AM
MySQL and SQL are essential skills for developers. 1.MySQL is an open source relational database management system, and SQL is the standard language used to manage and operate databases. 2.MySQL supports multiple storage engines through efficient data storage and retrieval functions, and SQL completes complex data operations through simple statements. 3. Examples of usage include basic queries and advanced queries, such as filtering and sorting by condition. 4. Common errors include syntax errors and performance issues, which can be optimized by checking SQL statements and using EXPLAIN commands. 5. Performance optimization techniques include using indexes, avoiding full table scanning, optimizing JOIN operations and improving code readability.
 Monitor Redis Droplet with Redis Exporter Service
Apr 10, 2025 pm 01:36 PM
Monitor Redis Droplet with Redis Exporter Service
Apr 10, 2025 pm 01:36 PM
Effective monitoring of Redis databases is critical to maintaining optimal performance, identifying potential bottlenecks, and ensuring overall system reliability. Redis Exporter Service is a powerful utility designed to monitor Redis databases using Prometheus. This tutorial will guide you through the complete setup and configuration of Redis Exporter Service, ensuring you seamlessly build monitoring solutions. By studying this tutorial, you will achieve fully operational monitoring settings
