
When I was using PyCharm to develop the django program, the method of printing logs to debug the program still felt a bit cumbersome and unintuitive, so I studied the breakpoint debugging method as follows:
1. Open your project and find Run-->Edit Configurations
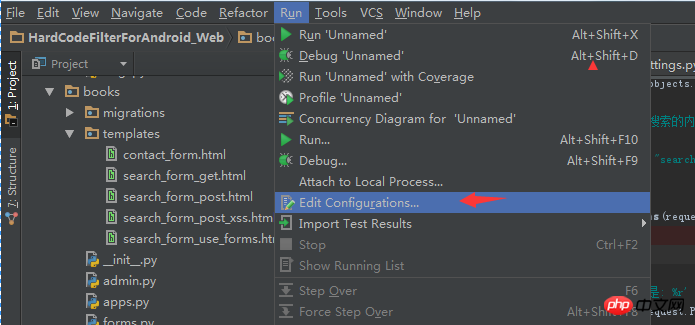 ## in the menu bar.
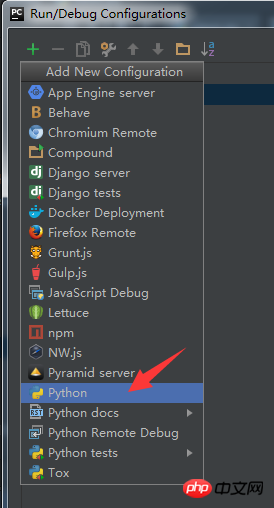
2. Select Python in the opened dialog box and click the + sign

## 4. Select Python
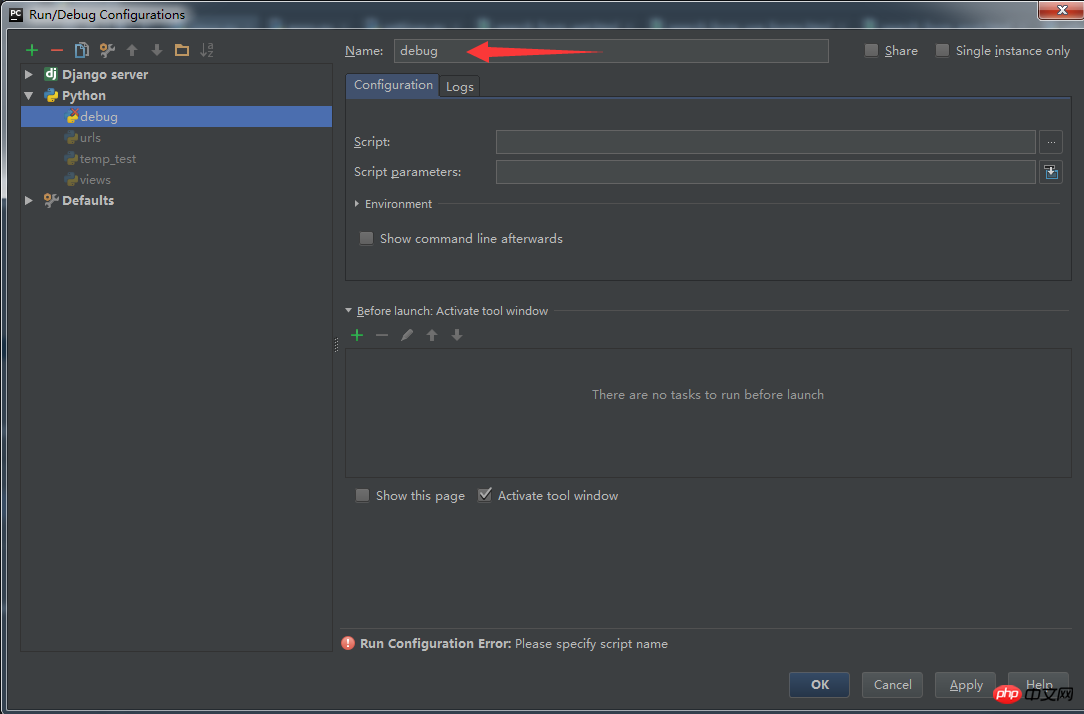
5. A new item Unnamed appears. You can rename it debug, which sounds nicer
#6. For the script, select manage.py of your website. Use runserver as the script parameter, just like you would normally use the command. The lines are the same. Smart students should have discovered it. You can also configure command parameters such as migrate (database synchronization) to realize the fast running of the command and save your hands.
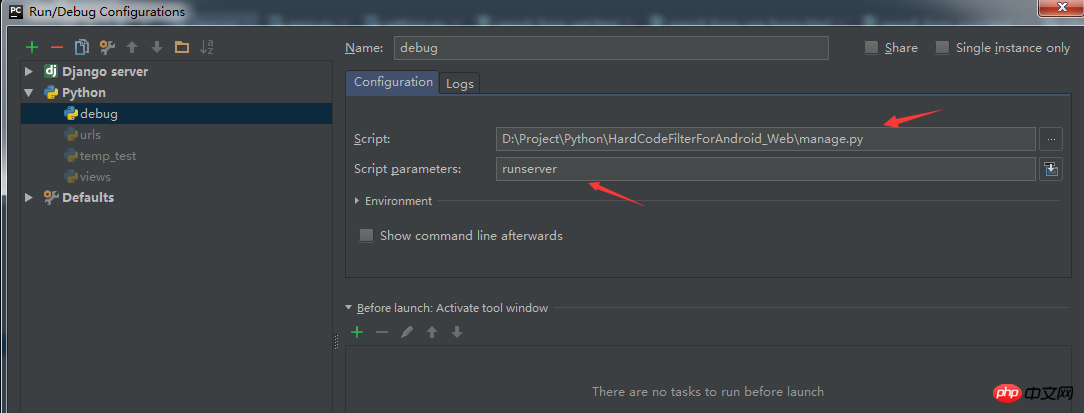
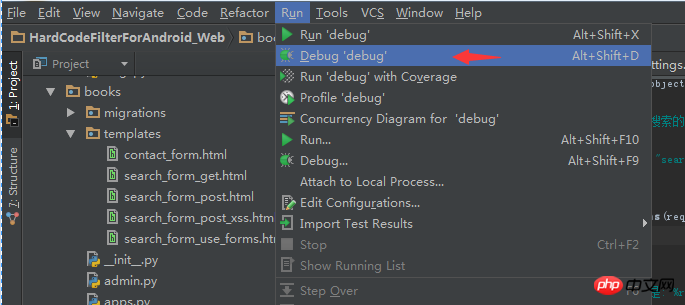
## 7. Then find Run-->Debug'debug' in the menu bar and click
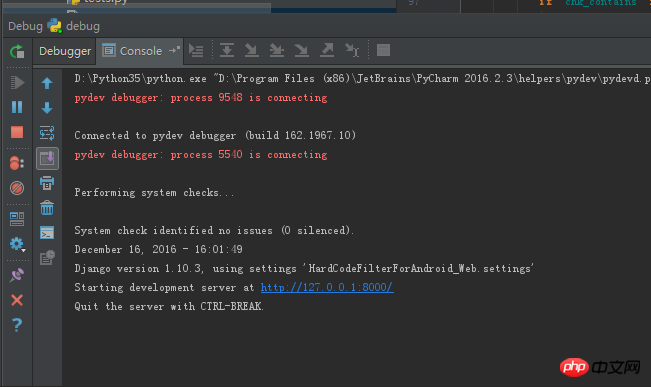
8. After running, you can see in the Console that the server has After running, there is a log printing
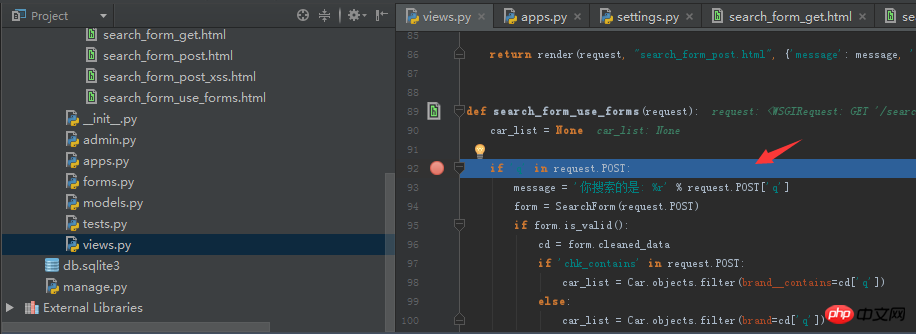
9. After that, Try adding breakpoints in your program. When the program reaches your breakpoint, it will freeze. Have fun debugging!
The above is the detailed content of Graphical introduction to PyCharm breakpoint debugging django steps. For more information, please follow other related articles on the PHP Chinese website!


