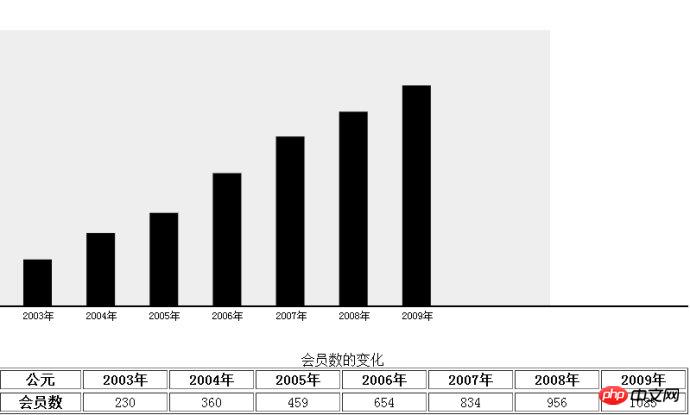
Since I did not organize it after writing it, the code structure inside is not very reasonable. Please forgive me. In addition, the coordinates of the drawing inside are also adjusted while drawing. They are for your reference only.
Rendering :

<!DOCTYPE html>
<html>
<head>
    <meta charset="utf-8">
    <title>绘制柱状图</title>
</head>
<body>
<p style="margin: 0 auto; width:800px; height:400px">
    <canvas id="can1" width="800" height="400">

    </canvas>
    <table border="1" style="width: 800px" id="tab1">
        <caption>会员数的变化</caption>
        <thead>
            <th>公元</th>
            <th>2003年</th>
            <th>2004年</th>
            <th>2005年</th>
            <th>2006年</th>
            <th>2007年</th>
            <th>2008年</th>
            <th>2009年</th>
        </thead>
        <tbody>
            <tr style="text-align: center">
                <th>会员数</th>
                <td>230</td>
                <td>360</td>
                <td>459</td>
                <td>654</td>
                <td>834</td>
                <td>956</td>
                <td>1085</td>
            </tr>
        </tbody>
    </table>
</p>
<script type="text/javascript">
    var can1=document.getElementByIdx_x_x("can1");
    var cxt=can1.getContext("2d");

    var cw=parseInt(can1.width);
    var ch=parseInt(can1.height);

    var basex=0;
    var basey=30;

    var gx=cw*0.8;
    var gy=ch*0.8;

    //第一步:绘制背景
    cxt.fillStyle="#eeeeee";
    cxt.fillRect(basex,basey,gx,gy);

    //第二步:下边我们获取我们表头当中的年份信息
    var tab1=document.getElementByIdx_x_x("tab1");
    var head_cells=tab1.tHead.rows[0].cells;
    var head=[];
    for(var i=1;i
        //获取年份写入到到我们的head数组当中
        head.push(head_cells[i].innerHTML);
    }

    //第三步:取得我们表当中的信息(取得第一个tbody的第一行的所有数据)
    var value_cells=tab1.tBodies[0].rows[0].cells;
    var value=[];
    for(var j=1;j
        var v=value_cells[j].innerHTML;
        //这里要注意进行类型转换,否则后边会出现莫名其妙的错误,像后面的求最大值,会出现错误
        v=parseInt(v);
        value.push(v);
    }

    //第四步:找出我们数据当中的最大的值,以便我们进行坐标的分配
    var max_value=0;

    for(var m=0;m
        if(value[m]>max_value){
            max_value=value[m];
        }
    }

    //第五步:绘制我们的坐标轴
    cxt.beginPath();
    cxt.fillStyle="black";
    cxt.lineWidth=2;
    //移动到我们图中所谓的坐标原点
    cxt.moveTo(0,0);
    //画纵轴
    cxt.lineTo(0,gy+basey);
    //画横轴
    cxt.lineTo(cw,gy+basey);
    cxt.stroke();

    //第六步:开始进行绘制,绘制标题的同时绘制数据

    //首先计算一下我们每个数值所代表的像素长度
    var each_len=gy*0.8/max_value;

    //计算横轴上每个方块所占的长度
    var each_room=gx*0.8/value.length;

    //开始绘制
    for(var h=0;h

        //开始绘制
        //1,绘制年份
        cxt.fillText(head[h],each_room*h+30,gy+basey*1.5);
        //33里边的方块宽度,这是一边画一边调的,所以很乱,大家可以自己调整
        cxt.fillRect(each_room*h+30,gy+basey-value[h]*each_len,33,value[h]*each_len);

    }
</script>
</body>
</html>Related articles:
html5 example code for generating histogram (bar chart) effect
Use HTML5 Canvas to draw histogram
The above is the detailed content of Use html to achieve simple histogram effect. For more information, please follow other related articles on the PHP Chinese website!


