
#Learn more about chart.js options to create beautiful charts. Interactive charts can provide a cool way to visualize your data. But most out-of-the-box solutions don't produce very beautiful charts with the default options.
In this article, I will teach you how to customize chart.js options to create cool charts.
We need:
Vue.js
vue-chart.js
vue-cli
Use vue-cli to build the basic structure. I hope you have installed it. We use vue-chart.js as the packager of chart.js.
vue init webpack awesome-charts
Then go to the project directory to install the dependencies:
cd awesome-charts && yarn install
Add vue-chartjs:
yarn add vue-chartjs -S
Now let’s create the first A discount table.
touch src/components/LineChart.js && subl .
Now we need to import the base table of the polyline table from vue-chartjs and create the component.
Use the data and options we prepared in the mount() function to call the renderChart() method.
import {Line} from 'vue-chartjs'
export default Line.extend({
mounted () {
this.renderChart({
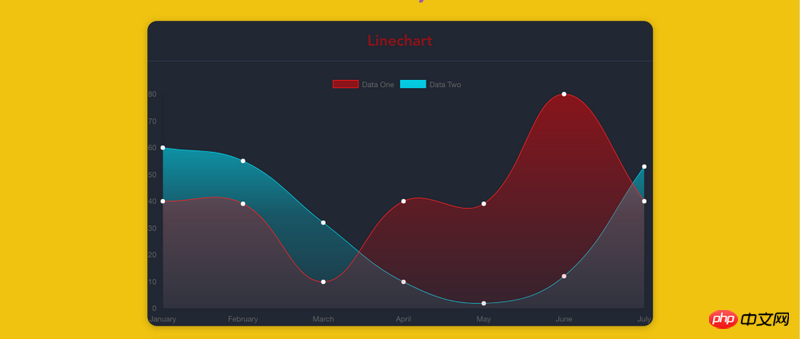
labels: ['January', 'February', 'March', 'April', 'May', 'June', 'July'],
datasets: [
{
label: 'Data One',
backgroundColor: '#FC2525',
data: [40, 39, 10, 40, 39, 80, 40]
},{
label: 'Data Two',
backgroundColor: '#05CBE1',
data: [60, 55, 32, 10, 2, 12, 53]
}
]
}, {responsive: true, maintainAspectRatio: false})
}
})In the code, some instance data and optional parameters are passed to the data object of chart.js, and responsive:true is set so that the chart will fill the outer container.
The reason why we can use the renderChart() method is because we inherit BaseChart. This method and some properties are defined in BaseChart.
ok, now delete Hello.vue from App.vue and introduce our chart:
    <template>
      <p id="app">
        <p class="container">
          <p class="Chart__list">
            <p class="Chart">
              <h2>Linechart</h2>
              <line-example></line-example>
            </p>
          </p>
        </p>
      </p>
    </template>

    <script>
    import LineExample from './components/LineChart.js'
    export default {
      name: 'app',
      components: {
        LineExample
      }
    }
    </script>

    <style>
    #app {
      font-family: 'Avenir', Helvetica, Arial, sans-serif;
      -webkit-font-smoothing: antialiased;
      -moz-osx-font-smoothing: grayscale;
      text-align: center;
      color: #2c3e50;
      margin-top: 60px;
    }
    .container {
      max-width: 800px;
      margin:  0 auto;
    }
    </style>
CopyRawRun the dev script in the terminal, You can see the chart.
yarn run dev
Now it’s time to do some beautification work
The above is the detailed content of How to create cool charts using Vue.js and Chart.js. For more information, please follow other related articles on the PHP Chinese website!


![[Web front-end] Node.js quick start](https://img.php.cn/upload/course/000/000/067/662b5d34ba7c0227.png)


