

JDK is a software development kit for the Java language. Without it, Java programs cannot be compiled. Currently, there are many JDK tools in front of everyone, but the most commonly used ones are java.exe, javac.exe, jar, etc. Besides these, what else are there? The author of this article, Joe, has many years of Java development experience. He shared an article on his blog: 5 JDK Tools Every Java Developer Should Know. The author compiled it and the following is the translation.
Currently, there are many tools that can be bound to Java JDK, among which java.exe and javac.exe are essential weapons for every Java engineer. At the same time, there are many other Java JDKs. The tools are in front of everyone’s eyes. Most Java programmers have never used these tools, but if they do, they will make your work more effective.
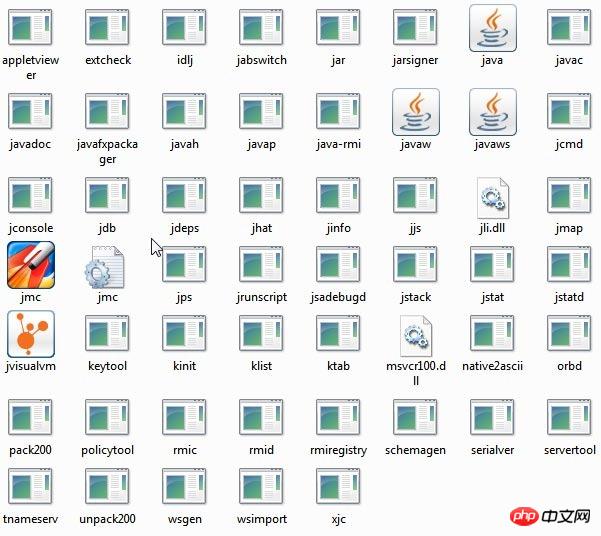
I have introduced these tools in previous tutorials. Now, I introduce to you the 5 most important tools.
1.javap
javap is a Java class file disassembler that can view the bytecode generated by the Java compiler and is a good tool for analyzing code. Let's use javap to compile this Hello World code and then break it down.
public class HelloWorld {
	public static void main(String... args) {
		System.out.println("Hello World!");
	}
}C:\Users\Cycle\Desktop>javap HelloWorld
I did not pass any parameters, I just ran the javap tool and got the above result. By default, it will output the package, protected, public fields and methods of Java classes.
Compiled from "HelloWorld.java"
public class HelloWorld {
  public HelloWorld();
  public static void main(java.lang.String...);
}C:\Users\Cycle\Desktop>javap -c HelloWorld
If you pass the parameter -c to javap, you will get the above result. This is a very good piece of information, and the instructions output like this can help us understand the JVM better.
Compiled from "HelloWorld.java"
public class HelloWorld {
  public HelloWorld();
    Code:
       0: aload_0
       1: invokespecial #1                  // Method java/lang/Object."":()V
       4: return

  public static void main(java.lang.String...);
    Code:
       0: getstatic     #2                  // Field java/lang/System.out:Ljava/io/PrintStream;
       3: ldc           #3                  // String Hello World!
       5: invokevirtual #4                  // Method java/io/PrintStream.println:(Ljava/lang/String;)V
       8: return
}2.jvisualvm
jvisualvm is a Java virtual machine monitoring and analysis tool. This tool provides a graphical interface window and can intuitively understand Java applications. runtime information. jvisualvm integrates many tools, such as jmp, jinfo, jstat, jstack, JConsole, etc. It has been part of the JDK since JDK 6 Update 7.
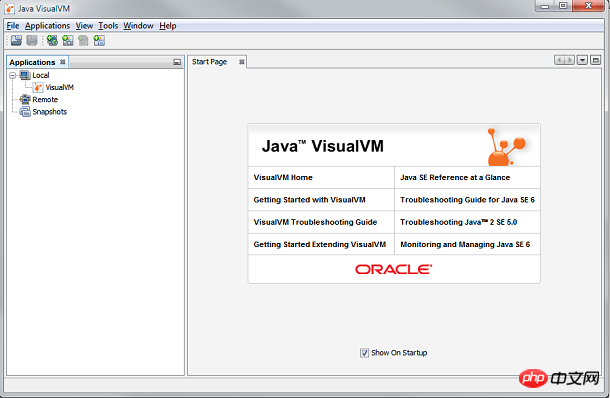
In this article on Java garbage collection monitoring and analysis, I have used jvisualvm. You may wish to go over and take a look at how to use jvisualvm.
3.jcmd
jcmd is mainly used to send diagnostic command requests to the Java JVM. When there is no jcmd parameter list in the JVM process, jcmd will run immediately . This is equivalent to the jps tool. I started jconsole and passed it as a parameter to jcmd. I got the following results. This can also be achieved through the process id (pid).
C:\Users\Cycle>jconsole

C:\Users\Cycle>jcmd JConsole help
3344:
The following commands are available:
JFR.stop
JFR.start
JFR.dump
JFR.check
VM.native_memory
VM.check_commercial_features
VM.unlock_commercial_features
ManagementAgent.stop
ManagementAgent.start_local
ManagementAgent.start
Thread.print
GC.class_stats
GC.class_histogram
GC.heap_dump
GC.run_finalization
GC.run
VM.uptime
VM.flags
VM.system_properties
VM.command_line
VM.version
help
C:\Users\Cycle>jcmd JConsole VM.uptime
3344:289.977 s
VM.uptime displays the specific running time of the Java application.
When debugging, the following parameters can be used for thread stack overflow of concurrent locks.
jcmdThread.print -l
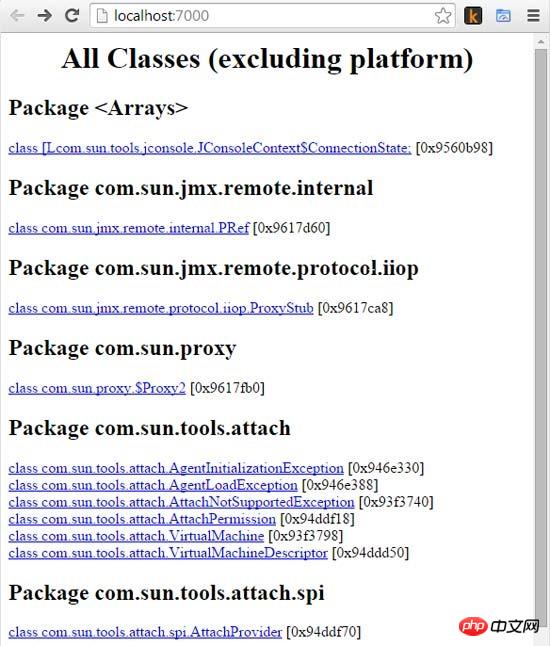
4.jhat
The full name of jhat is Java heap analysis tool. It is mainly used to parse and browse heap files, jhat is sometimes more like a visualization tool. jhat parses the heap dump and starts a webserver, and then the user can view the heap in the browser. jhat supports object query language (oql) and some pre-designed queries.
To use the jmap tool to generate a heap dump, we should use the -dump parameter. The following is a list of parameters that the jhat tool can use:
C:\Users\Cycle>jhat -help
Usage:  jhat [-stack ] [-refs ] [-port ] [-baseline ] [-debug ] [-version] [-h|-help]

        -J          Pass  directly to the runtime system. For
                          example, -J-mx512m to use a maximum heap size of 512MB
        -stack false:     Turn off tracking object allocation call stack.
        -refs false:      Turn off tracking of references to objects
        -port :     Set the port for the HTTP server.  Defaults to 7000
        -exclude :  Specify a file that lists data members that should
                          be excluded from the reachableFrom query.
        -baseline : Specify a baseline object dump.  Objects in
                          both heap dumps with the same ID and same class will
                          be marked as not being "new".
        -debug :     Set debug level.
                            0:  No debug output
                            1:  Debug hprof file parsing
                            2:  Debug hprof file parsing, no server
        -version          Report version number
        -h|-help          Print this help and exit
                    The file to read

For a dump file that contains multiple heap dumps,
you may specify which dump in the file
by appending "#" to the file name, i.e. "foo.hprof#3".

All boolean options default to "true"I created a heap dump file for the jconsole application. And use the following command to run process id 3344:
jmap -dump:format=b,file=heap.bin 3344
Now, the heap dump file is ready, run the following command and it will Start a service:
jmap -dump:format=b,file=heap.bin 3344
Output results on the console:
C:\Users\Cycle\Desktop>jhat heap.bin
Reading from heap.bin...
Dump file created Sun Nov 16 19:26:35 IST 2014
Snapshot read, resolving...
Resolving 641209 objects...
Chasing references, expect 128 dots..................
Eliminating duplicate references.....................
Snapshot resolved.
Started HTTP server on port 7000
Server is ready.
Enter in the browser: http After ://localhost:7000/, the details of the heap dump will come out:
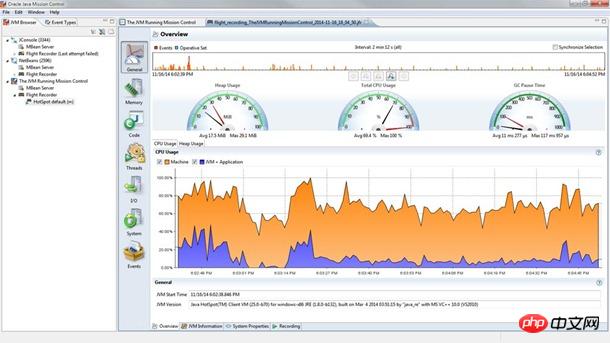
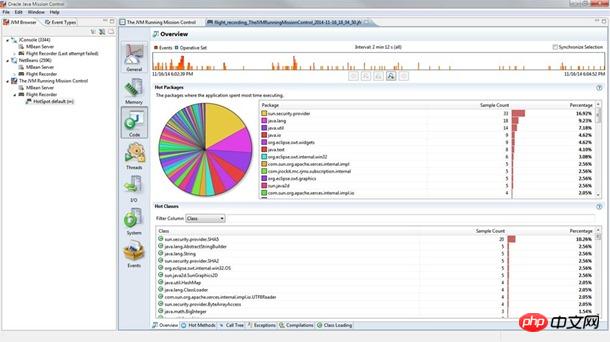
5.Oracle Java Mission Control
As part of the JVM integration strategy, it is mainly used to unify HotSpot and JRockit VMs. Currently, JRockit Mission Control is available in the standard version of Java SE. Java Mission Control (JMC) works with Java Flight Recorder for the HotSpot JVM to record core data and events. It is a tuning tool and works with Oracle JDK. Once a problem arises, this data can be used for analysis.
Developers can use the jmc command to create JMC tools.
The above is the detailed content of 5 JDK Tools Every Java Developer Should Know. For more information, please follow other related articles on the PHP Chinese website!


![[Web front-end] Node.js quick start](https://img.php.cn/upload/course/000/000/067/662b5d34ba7c0227.png)


