

Series Article Index
One of .NET Performance Tuning: ANTS Use of Performance Profiler
#.NET performance tuning part 2: using Visual Studio for code measurement
.NET performance tuning Part 3: Tuning tools and methods for YSlow related rules
Using .NET After you quickly get started and develop an application, the next problem you face may be program performance tuning. Performance tuning sometimes involves various aspects, such as program hosting system, database, network environment, etc., and When the program is extremely large and complex, performance tuning will become even more difficult to start.
This series of articles will mainly introduce some .NET performance tuning tools, Web performance optimization rules (such as YSlow) and methods, etc. The last thing I want to see before it is written is the endless debate in the garden about "which language is better and which language has higher performance". Without further ado, anyone who really understands should know whether such a debate is meaningful. I hope we can start from the practical point of view. Discuss the problem from the perspective of performance optimization.
ANTS Performance Profiler is a powerful performance tuning product of RedGate. The official product page is here.
Let’s first look at the basic use of the software.
Use the following code for a simple test.
This is a console application. The program is very simple. First loop 10,000 times, output the sum, and then use LINQ to find the value of 1000 in the list and output it.
1 static void Main() 2 { 3 var list = new List<int>(); 4 5 var sum = 0; 6 for (var i = 0; i < 10000; i++) 7 { 8 sum += i; 9 list.Add(i);10 }11 Console.WriteLine(sum);12 13 //find the value use linq: 100014 var result = list.Where(p => p.Equals(1000));15 foreach (var i in result)16 {17 Console.WriteLine(i);18 }19 Console.ReadKey();20 }After compiling the program, start ANTS Performance Profiler, and a wizard page will automatically pop up. On this page, you can see that the software supports performance monitoring of a variety of .NET programs, such as EXE, web, Windows Service, etc. .
In Performace Counters, you can choose a variety of counters according to your needs, such as IO, memory allocation, processor, etc.
For testing DEMO, select the compiled exe file path. Because it was debug compilation just now, select the exe in \bin\Debug\ under the program folder.
In Profiling Mode, you can select the level of monitoring, which is basically a balance between the amount of monitoring information and the speed. The default selection is "most detailed". For other detailed settings, please refer to the help document.
Click "Start Profiling" to start the program.

The basic working principle of the software is to put hooks in the IL code compiled by .NET to record time. Then an intuitive interface shows which parts of the code consume the most energy. So this is the most direct method of performance tuning, just optimize the most time-consuming code segments.
Click "Start Profiling" to start the previously compiled program, and the software will start execution. If it is other interactive programs such as winform, web, etc., after operating the functions that require performance tuning, Just use the mouse to select the time period you want to view in the running timeline at the top. Generally, there will be a peak during the time period when there are performance problems, just select that time period.

After selection, you can immediately see the most time-consuming method in the result window below, such as the DEMO above. Of course, the performance is consumed in the Main function superior.

The software provides a variety of measurement values to view performance losses, including percentages and multiple time formats. Here, "seconds" is selected as the unit of measurement.

# Then select the function you want to view, and the power of the software will become apparent.
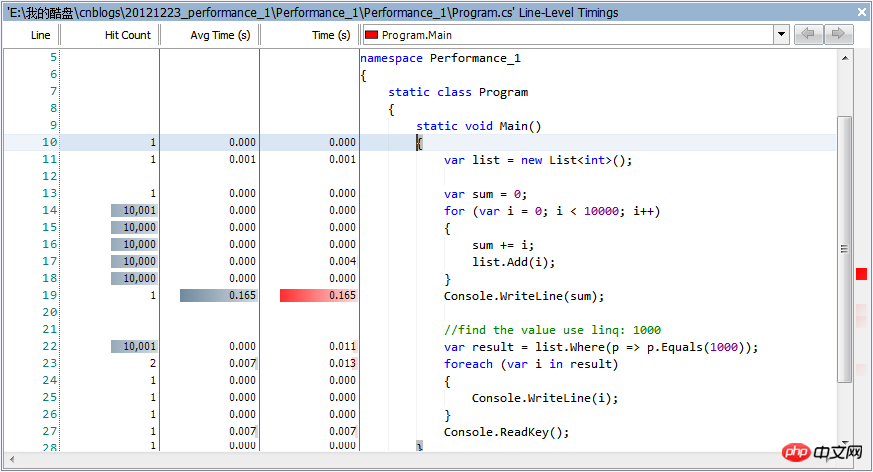
Click on the red line on the right to quickly locate the most energy-consuming code. The darker the color, the more energy-consuming the code is.
On the left you can see the line number, the number of times this code has been executed (Hit Count), the average execution time, the total execution time, and of course you can also see the code for analysis. .
As for why this code in the DEMO consumes so much energy when executing Console.WriteLine for the first time, I think you should be able to know if you read the first chapter of "CLR via C#" carefully. The answer is.
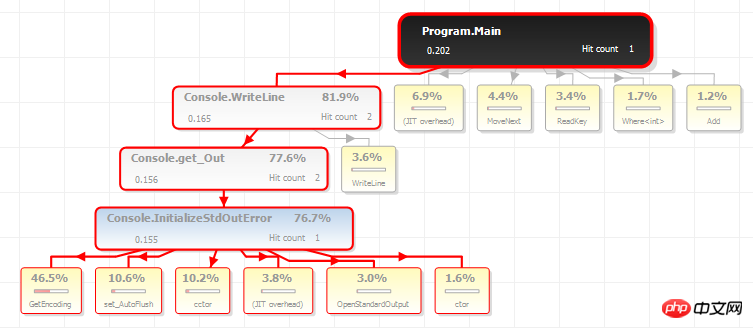
Of course, you can also click on the hierarchy icon to view a more intuitive performance loss, like the following.
Another benefit of such a hierarchical structure diagram is that you can see the internal implementation of the .NET Framework.
When making some decisions, such as whether to use native functions or third-party components, this function will become very useful, because it can more intuitively see where the performance bottlenecks of the internal implementation are.
ANTS Performance Profiler is my first and favorite tool for performance tuning, so I put it in the first article. Let me share it with you, I hope it can be of some help to you.
It is very intuitive and powerful. Because the complex project at hand is not suitable for DEMO, so I just wrote a simple code for demonstration. Its power can only be used when you actually encounter performance problems. It’s time to experience it.
If there are any omissions or additions in the article, please leave a message to discuss together, and please also pay attention to subsequent related articles.
If the article is helpful to you, please recommend it, thank you :)
The above is the detailed content of ANTS Performance Profiler (.NET performance tuning tutorial). For more information, please follow other related articles on the PHP Chinese website!


![[Web front-end] Node.js quick start](https://img.php.cn/upload/course/000/000/067/662b5d34ba7c0227.png)


