

Code debugging basics for getting started with Pycharm

This article mainly introduces the third part of the most complete Pycharm learning tutorial to code running and debugging in detail. It has certain reference value. Interested friends can refer to
Pycharm code running and debugging. , the specific content is as follows
1. Preparation
(1) The Python version is 2.7 or higher
(2) A Python project has been created and the content has been added , specific reference: Getting Started tutorial
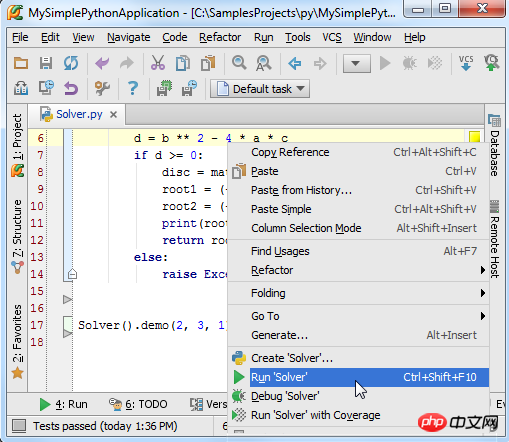
2. Step 1 - Run the code
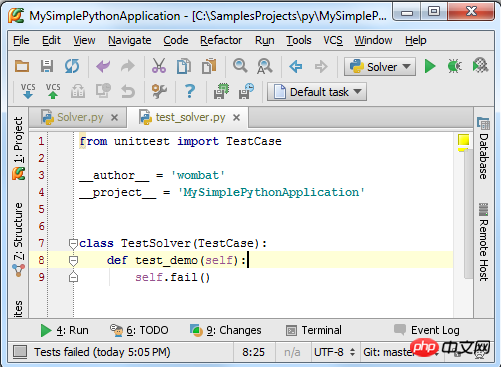
Open the Solver.py file written before, right-click in the edit box and select "Run" in the shortcut menu 'Solver'" option.
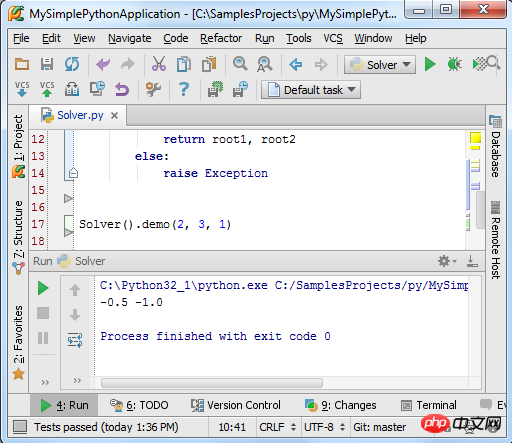
At this time, the script file runs normally and the output value of the program is displayed in the debugging tool window:
Next We will explain the specific contents of these two steps in detail.
3. What is Run/Debug mode
Each script file that needs to be run/debug needs a special configuration file to specify its script name and directory. and other important running debugging information. Pycharm has integrated this configuration file to avoid users having to create it manually.
Every time you click the Run or Debug button (or perform the same operation in the shortcut menu), the current run/debug configuration file is actually loaded into the current Debugging Model.
If you look carefully at the first picture, you will find that there is no run/debug related information in the combo box at all, and they only appear in the second picture. This means that the run/debug configuration file of the Solver script will be automatically generated when the run/debug command is executed, as shown now.
At this time, the two buttons Run (green arrow button) and Debug (green beetle button) become available in the main toolbar:
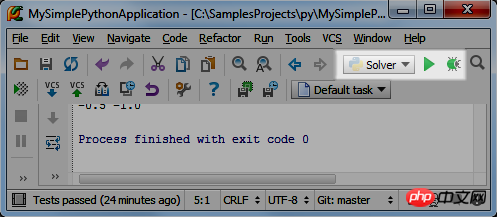
At the same time, this The two icons are still semi-transparent, which means they are temporary, automatically created by Pycharm.
OK, click the drop-down arrow to view the currently available command operations:
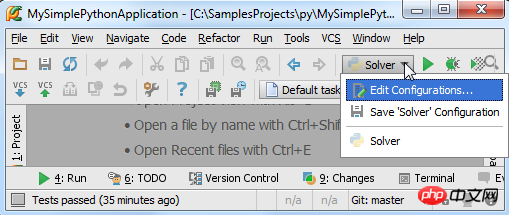
If you have set up multiple run/debug configuration schemes, they will all Displayed heredrop-down list, click to select one as the run/debug configuration file of the current project.
4. Save run/debug configuration information
In the drop-down list above, click the Edit configuration option to open the run/debug configuration editing window:
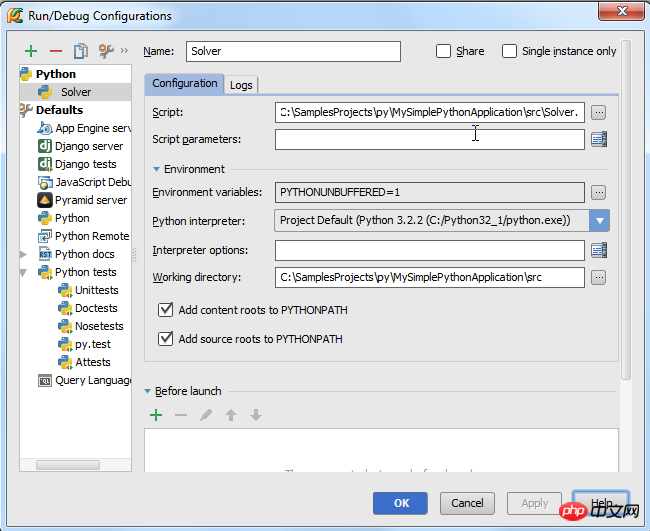
Two nodes will appear in the left directory: Python and Default. There is a single configuration option 'Solver' under the first node directory, and under the second option there are many configuration information.
What does this mean?
Under the Default node, you can only see the name of the framework or the mode name. If you create a new Run/Debug configuration file, it will branch in the selected mode Create it under the Default node. If you change the settings under the Default node, all configuration files related to it will be changed accordingly.
For example, if you want to replace the Python interpreter used in Pycharm with a remote or local interpreter, you can change the interpreter settings under the Python page so that all new debugging configuration files will use this new one. interpreter.
In the early Python node, only a single configuration option 'Solver' was used. It was a Python type configuration, but it was different from the Python mechanism under the Default node. It was represented by a non-transparent icon. , which is used to indicate the saving status of the current configuration file. When you save the configuration file, the icon will become opaque. For example, we create a new configuration file for the current Solver script under the Python type and name it 'Solver1'. If you make any changes to an existing configuration file, these changes will only be applied to the corresponding script area.
5. Official operation
We have been able to run the script in a very direct way. Next, we will look for other ways to run the script.
As we know, running a script means loading the current debugging configuration file. Therefore, running a script mainly follows the following process:
(1) In the main toolbar, click the run/debug group box to confirm the current debugging configuration file information
(2) Do the following (select one of the three):
Click the Run button to load the configuration file
Press the Shift+F10 shortcut key
On the main menu, select Run → Run
At this point, we You can observe the running results of the program in the Run tool window.
6. Run the test program
We are not discussing the importance of code testing here, but exploring how Pycharm can help us complete this function.
7. Select a tester
First, you need to specify a tester. Click the Settings button on the toolbar to open the Settings/Preferences dialog box, and then click to enter the Python Intergated Tools page (can be found through the search function). The default selection is as follows:
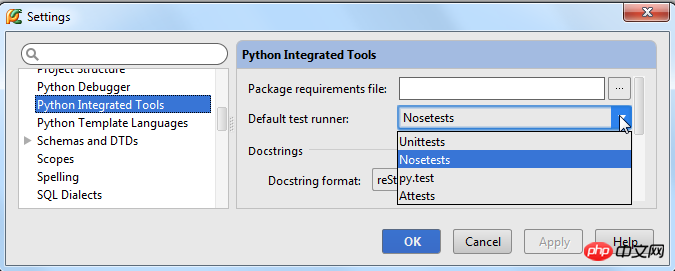
Here we select Nosetests, save and close the dialog box.
8. Create a test program block
First we create a test instance. Pycharm provides a very smart way to create test code: click to select the class name and press the Ctrl+Shift+T shortcut key, or select Navigate → Test in the main menu. If the test program already exists, it will jump directly Go to the corresponding code, otherwise create it:
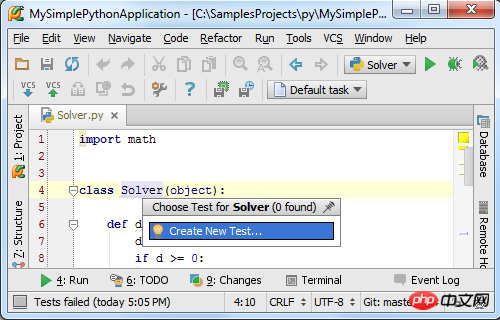
Follow the system prompts, Pycharm will display the following dialog box:
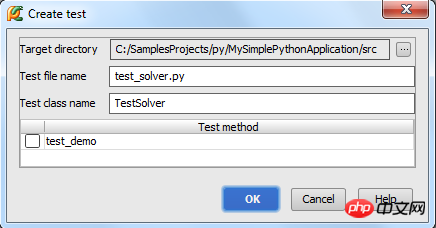
Click the OK button to view the creation result:
function.
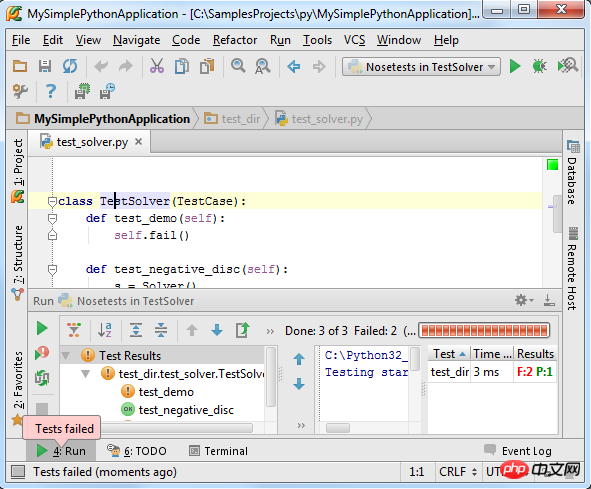
9. Run the test code After everything is ready, right-click the test class name and select the run command in the pop-up shortcut menu: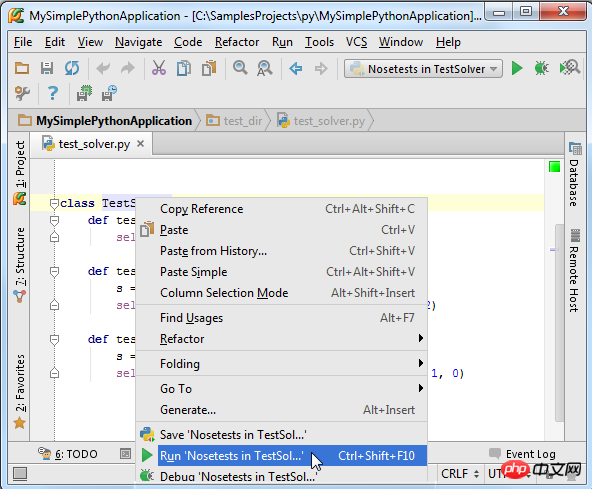
properties. If you want to change the properties of the breakpoint, Right-click the breakpoint:
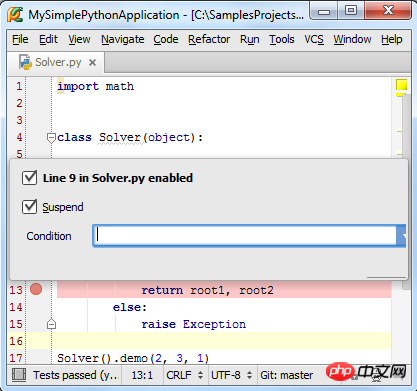
(2) The line of code where the breakpoint is located turns blue, which means that the Pycharm program process has reached the breakpoint, but the code marked by the breakpoint has not yet been executed.
(3) The Debug tool window appears, showing the current important debugging information and allowing the user to make changes to the debugging process.
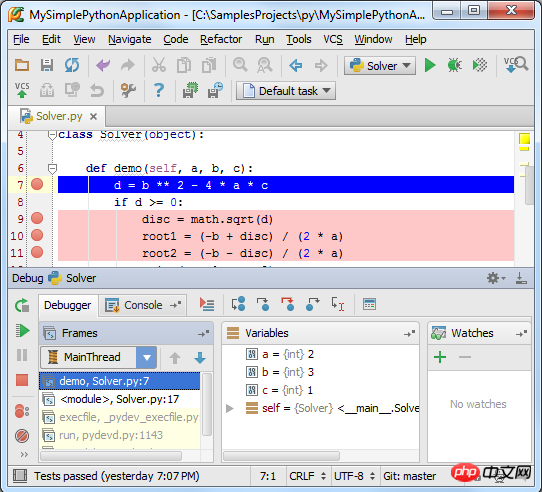
Although the Pycharm user manual has fully provided the functional information of all controls in the debugging window, we still briefly introduce them here. We find that the window is divided into two tabs: Debugger tab and the Console tab.
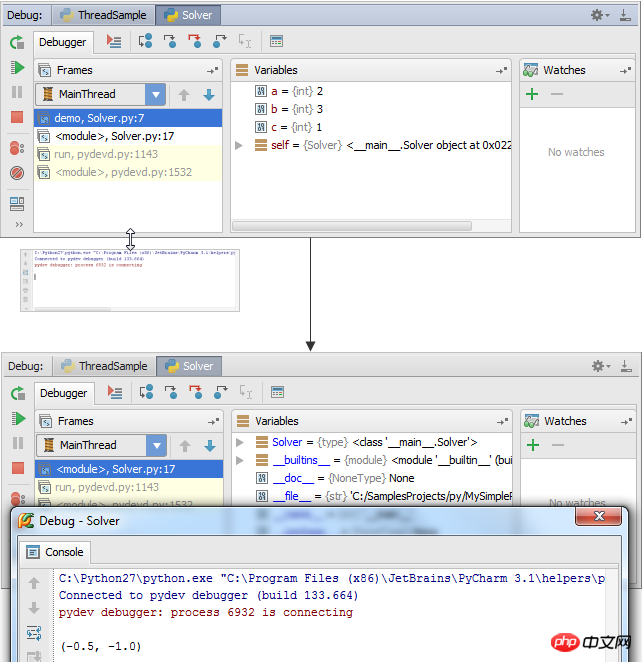
(1) The Debugger window is divided into three visible areas: Frames, Variables, and Watches. These windows list the current framework and running processes, allowing users to view the status of variables in the program space, etc. When you select a frame, related variable information will be displayed. Of course, these areas can be folded and hidden.
(2) The Console window displays the current console output information. By default, this window is located under the Debugger. You can click its label to display it in front.
Of course we can change the placement of these windows, if you don’t like the default layout of the program. See the Moving tabs and areas chapter for details.
The working mode of the Debugger window:
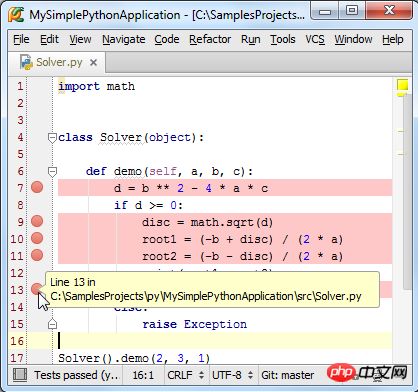
OK, now the program is suspended at the first breakpoint, and the Frames window displays the process demo corresponding to the 7th line of code in the Solver script, related Variables a, b, c have been defined, but variable d has not yet been defined. Next?
Press F9 (or the green arrow on the left toolbar), and the program will continue to run to the next breakpoint. In this way, you can run each breakpoint again and observe the changes in variables. .
For more information about the Debugger window, please refer to the software manual: product documentation
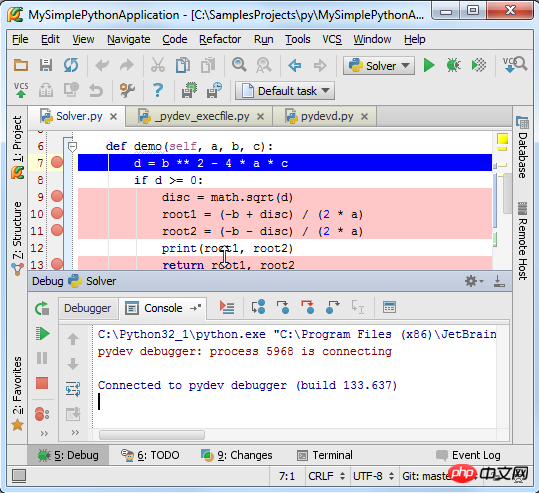
The working mode of the Console window:
Why do you need to use the Console window? When we need to view the error message given by the program, or perform some additional temporary operations, we need to do it in this window.
Click the Console tab to bring it to the front:
Then click the command button in the left toolbar to display the Python command prompt :
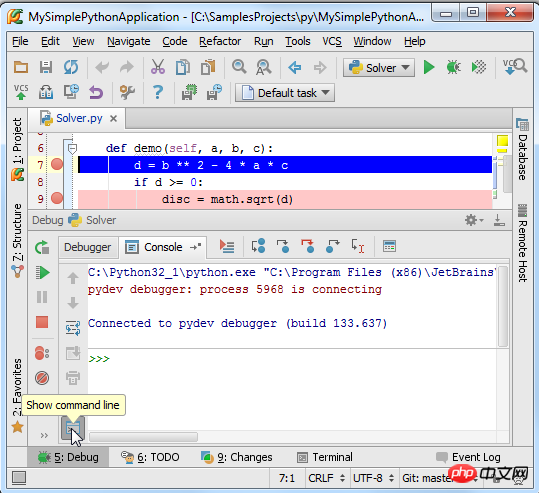
At this point the console mechanism is activated and try to execute some Python commands in it:
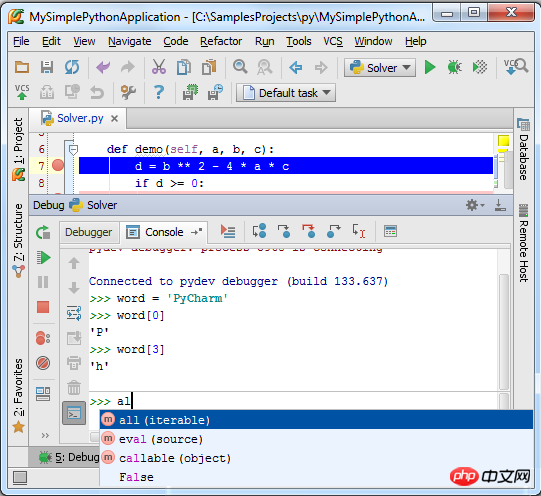
Notice the control The console window provides code spelling tips (Ctrl+Space) and historical memory (Up/Down keys) functions. For more information, see: Using Debug Console
Finally, if you want the Console window to be always available, Just move it into a separate window:
14. Run again
After completing this debugging run and loading the debugging configuration again After file, we can run debugging again by clicking the run button on the toolbar.
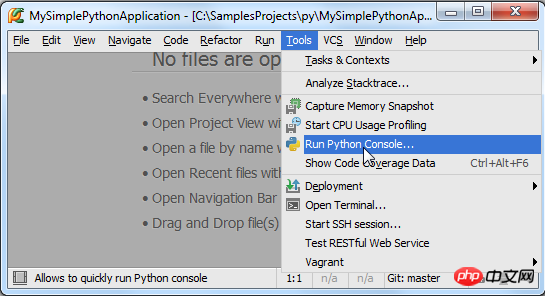
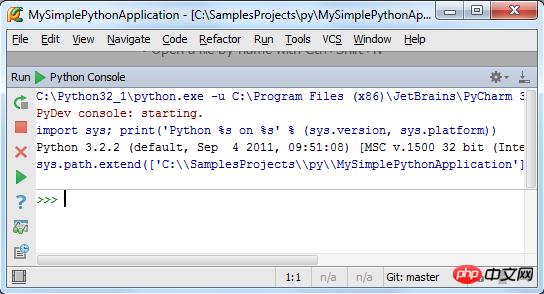
15. REPL - Debugging programs in the console interface
Finally, if you are more accustomed to working in a console environment, you can also set Pycharm to console mode. Select Tools → Run Python Console... in the main menu to load the console:
At this time, the console window will be activated and displayed as a separate window:
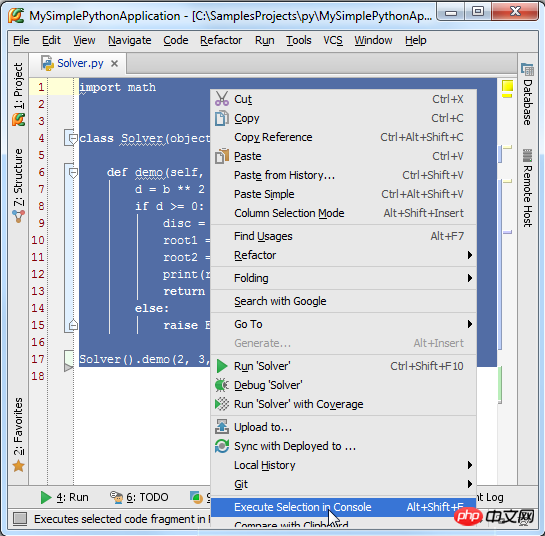
We can do a lot of interesting things in this console window. Next we demonstrate how to import the code in the recently written Solver.py file into the console:
Open the Solver.py file (there are various ways to open it, such as Ctrl+E - View → Recent Files), select all the code content in the file (Ctrl+A, or Edit → Select All), and then Press Alt+Shift+E (or right-click and select Execute Selection in Console in the pop-up shortcut menu):
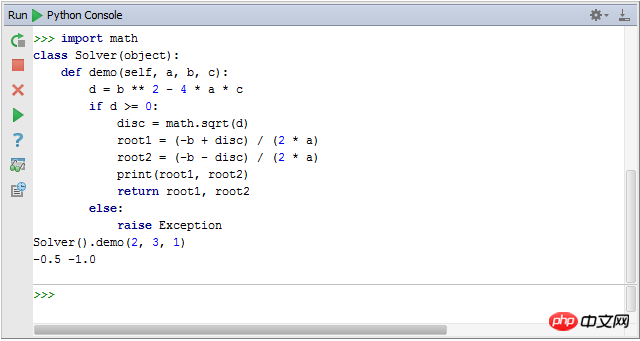
At this time, Pycharm will automatically select the selected code Import it into the console interface so that we can edit it:
【Related recommendations】
3. Python object-oriented video tutorial
The above is the detailed content of Code debugging basics for getting started with Pycharm. For more information, please follow other related articles on the PHP Chinese website!

Hot AI Tools

Undresser.AI Undress
AI-powered app for creating realistic nude photos

AI Clothes Remover
Online AI tool for removing clothes from photos.

Undress AI Tool
Undress images for free

Clothoff.io
AI clothes remover

Video Face Swap
Swap faces in any video effortlessly with our completely free AI face swap tool!

Hot Article
Hot Tools

Notepad++7.3.1
Easy-to-use and free code editor

SublimeText3 Chinese version
Chinese version, very easy to use

Zend Studio 13.0.1
Powerful PHP integrated development environment

Dreamweaver CS6
Visual web development tools

SublimeText3 Mac version
God-level code editing software (SublimeText3)
Hot Topics
 1392
1392
 52
52

 The reason why pycharm runs very slowly
Apr 25, 2024 am 05:42 AM
The reason why pycharm runs very slowly
Apr 25, 2024 am 05:42 AM
Reasons for PyCharm to run slowly include: Hardware limitations: low CPU performance, insufficient memory, and insufficient storage space. Software related issues: Too many plugins, indexing issues, and large project sizes. Project configuration: Improper configuration of the Python interpreter, excessive file monitoring, and excessive resource consumption by the code analysis function.
 How to run ipynb file in pycharm
Apr 25, 2024 am 04:03 AM
How to run ipynb file in pycharm
Apr 25, 2024 am 04:03 AM
To run an ipynb file in PyCharm: open the ipynb file, create a Python environment (optional), run the code cell, use an interactive environment.
 How to solve pycharm crash
Apr 25, 2024 am 05:09 AM
How to solve pycharm crash
Apr 25, 2024 am 05:09 AM
Solutions to PyCharm crashes include: check memory usage and increase PyCharm's memory limit; update PyCharm to the latest version; check plug-ins and disable or uninstall unnecessary plug-ins; reset PyCharm settings; disable hardware acceleration; reinstall PyCharm; contact Support staff asked for help.
 How to delete the pycharm interpreter
Apr 25, 2024 am 05:54 AM
How to delete the pycharm interpreter
Apr 25, 2024 am 05:54 AM
To remove the PyCharm interpreter: Open the Settings window and navigate to Interpreters. Select the interpreter you want to delete and click the minus button. Confirm the deletion and reload the project if necessary.
 How to export py files with pycharm
Apr 25, 2024 am 06:24 AM
How to export py files with pycharm
Apr 25, 2024 am 06:24 AM
How to export Py files in PyCharm: Open the file to be exported, click the "File" menu, select "Export File", select the export location and file name, and click the "Export" button
 How to change python to Chinese
May 05, 2024 pm 07:48 PM
How to change python to Chinese
May 05, 2024 pm 07:48 PM
Method to modify the Python interface to Chinese: Set the Python language environment variable: set PYTHONIOENCODING=UTF-8 Modify the IDE settings: PyCharm: Settings>Appearance and Behavior>Appearance>Language (Chinese); Visual Studio Code: File>Preferences>Search "locale" > Enter "zh-CN" to modify the system locale: Windows: Control Panel > Region > Format (Chinese (China)); macOS: Language and Region > Preferred Language (Chinese (Simplified) drag to the top of the list)
 How to install pandas module in pycharm
Apr 25, 2024 am 10:03 AM
How to install pandas module in pycharm
Apr 25, 2024 am 10:03 AM
How to install the Pandas module using PyCharm: Open PyCharm, create a new project, and configure the Python interpreter. Enter the command pip install pandas in the terminal to install Pandas. Verify installation: Import pandas in PyCharm's Python script. If there are no errors, the installation is successful.
 How to bring up the pycharm menu bar
Apr 25, 2024 am 10:48 AM
How to bring up the pycharm menu bar
Apr 25, 2024 am 10:48 AM
The menu bar in PyCharm provides quick access to various functions and options. To restore the menu bar: Click the View menu. Select the "Toolbar" option. Check the "Menu Bar" checkbox. Click OK. The menu bar contains the following menus: File, Edit, View, Navigate, Refactor, Run, Debug, Tools, VCS, Window, and Help.
