
 Operation and Maintenance
Linux Operation and Maintenance
Graphic tutorials on the use of several network traffic monitoring tools under Linux
Operation and Maintenance
Linux Operation and Maintenance
Graphic tutorials on the use of several network traffic monitoring tools under Linux
Graphic tutorials on the use of several network traffic monitoring tools under Linux

1. nethogs
1) NetHogs is an open source, free, network traffic monitoring tool under the terminal. It can monitor the process or process of Linux Application network traffic. NetHogs can only monitor the network bandwidth usage of the process in real time. NetHogs supports IPv4 and IPv6 protocols, local network cards and PPP links
2) Install under debian
apt- get install nethogs
Install under centos
yum install nethogs
3) Use the command nethogs to view traffic data in real time
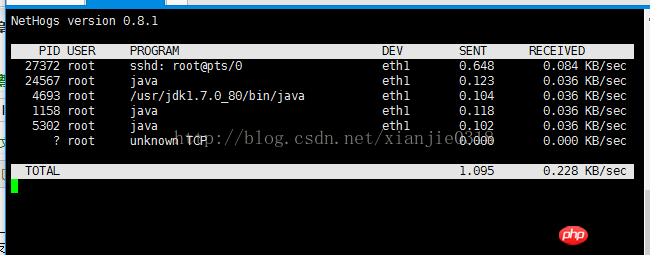
View the function nodes corresponding to each process to monitor the amount of network traffic data consumption
4)NetHogs provides interactive control instructions:
m : Cycle between display modes (kb/s, kb, b, mb) Switch the network speed display unit
r : Sort by received. Sort by received traffic
s: Sort by sent. Sort by sent traffic
q: Quit and return to the shell prompt. Exit the NetHogs command tool
2, nload
can monitor in real time The traffic of the network card is divided into two parts: input traffic Incoming and output traffic Outgoing. At the same time, the current, average, minimum, maximum, and total traffic values are counted, and displayed in a dynamic graphic format so that you can see them clearly at a glance
Install apt-get install nload yum install nload
nload

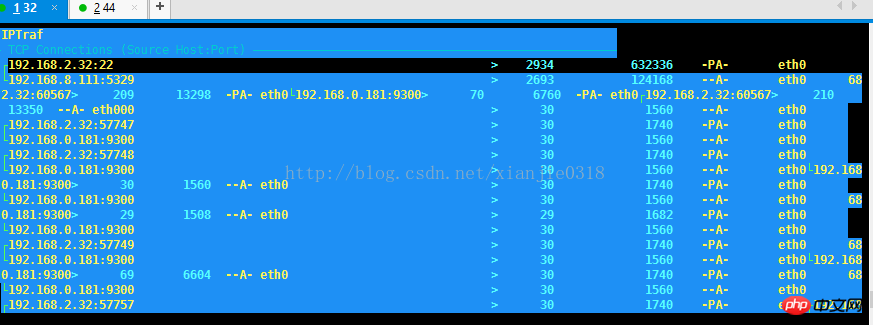
1) iptraf is an IP LAN monitor based on ncurses, used to generate Including TCP information, UDP count, ICMP and OSPF information, Ethernet load information, node status information, IP checksum errors and other statistical data.
Its ncurses-based user interface saves users from remembering tedious command line switches.
Features
IP traffic monitor, used to display IP traffic change information in your network. Includes TCP identification information, packet and byte counts, ICMP details, and OSPF packet types.
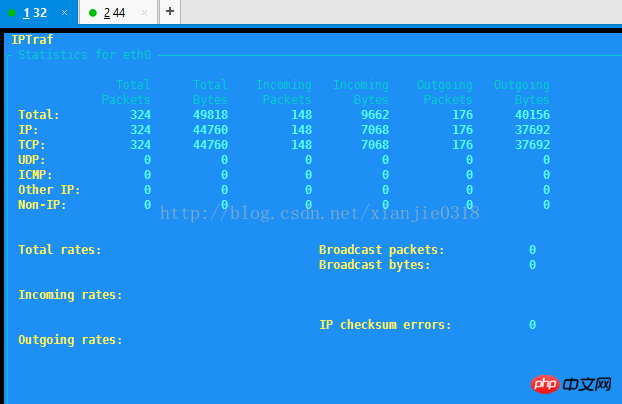
Simple and detailed Interface statistics, including IP, TCP, UDP, ICMP, non-IP and other IP packet counts, IP checksum errors , interface activity, packet size counts.
TCP and UDP service monitor, able to display the number of packets sent and received on common TCP and UDP application ports.
The LAN data statistics module can discover online hosts and display statistical information on data activities on them.
Display of TCP, UDP, and other protocols Filters, allowing you to view only the traffic of interest.
Log function.
Supports Ethernet, FDDI, ISDN, SLIP, PPP and local loopback interface types.
Utilizes the raw socket interface built into the Linux kernel, allowing it (referring to iptraf) to be used on various supported network cards
Full screen, menu driven operation.
Real-time viewing via
Navigationmenu
IP traffic monitorGeneral Interface Statistics of the network interface
Details of the network interface Detailed Interface Statistics
Statistical
BreakdownsLAN Station Statistics
Filters...
Configuration( Configure...)
Exit
The above is the detailed content of Graphic tutorials on the use of several network traffic monitoring tools under Linux. For more information, please follow other related articles on the PHP Chinese website!

Hot AI Tools

Undresser.AI Undress
AI-powered app for creating realistic nude photos

AI Clothes Remover
Online AI tool for removing clothes from photos.

Undress AI Tool
Undress images for free

Clothoff.io
AI clothes remover

Video Face Swap
Swap faces in any video effortlessly with our completely free AI face swap tool!

Hot Article
Hot Tools

Notepad++7.3.1
Easy-to-use and free code editor

SublimeText3 Chinese version
Chinese version, very easy to use

Zend Studio 13.0.1
Powerful PHP integrated development environment

Dreamweaver CS6
Visual web development tools

SublimeText3 Mac version
God-level code editing software (SublimeText3)
Hot Topics
 1386
1386
 52
52

 How to use docker desktop
Apr 15, 2025 am 11:45 AM
How to use docker desktop
Apr 15, 2025 am 11:45 AM
How to use Docker Desktop? Docker Desktop is a tool for running Docker containers on local machines. The steps to use include: 1. Install Docker Desktop; 2. Start Docker Desktop; 3. Create Docker image (using Dockerfile); 4. Build Docker image (using docker build); 5. Run Docker container (using docker run).
 How to view the docker process
Apr 15, 2025 am 11:48 AM
How to view the docker process
Apr 15, 2025 am 11:48 AM
Docker process viewing method: 1. Docker CLI command: docker ps; 2. Systemd CLI command: systemctl status docker; 3. Docker Compose CLI command: docker-compose ps; 4. Process Explorer (Windows); 5. /proc directory (Linux).
 Difference between centos and ubuntu
Apr 14, 2025 pm 09:09 PM
Difference between centos and ubuntu
Apr 14, 2025 pm 09:09 PM
The key differences between CentOS and Ubuntu are: origin (CentOS originates from Red Hat, for enterprises; Ubuntu originates from Debian, for individuals), package management (CentOS uses yum, focusing on stability; Ubuntu uses apt, for high update frequency), support cycle (CentOS provides 10 years of support, Ubuntu provides 5 years of LTS support), community support (CentOS focuses on stability, Ubuntu provides a wide range of tutorials and documents), uses (CentOS is biased towards servers, Ubuntu is suitable for servers and desktops), other differences include installation simplicity (CentOS is thin)
 What to do if the docker image fails
Apr 15, 2025 am 11:21 AM
What to do if the docker image fails
Apr 15, 2025 am 11:21 AM
Troubleshooting steps for failed Docker image build: Check Dockerfile syntax and dependency version. Check if the build context contains the required source code and dependencies. View the build log for error details. Use the --target option to build a hierarchical phase to identify failure points. Make sure to use the latest version of Docker engine. Build the image with --t [image-name]:debug mode to debug the problem. Check disk space and make sure it is sufficient. Disable SELinux to prevent interference with the build process. Ask community platforms for help, provide Dockerfiles and build log descriptions for more specific suggestions.
 What computer configuration is required for vscode
Apr 15, 2025 pm 09:48 PM
What computer configuration is required for vscode
Apr 15, 2025 pm 09:48 PM
VS Code system requirements: Operating system: Windows 10 and above, macOS 10.12 and above, Linux distribution processor: minimum 1.6 GHz, recommended 2.0 GHz and above memory: minimum 512 MB, recommended 4 GB and above storage space: minimum 250 MB, recommended 1 GB and above other requirements: stable network connection, Xorg/Wayland (Linux)
 vscode cannot install extension
Apr 15, 2025 pm 07:18 PM
vscode cannot install extension
Apr 15, 2025 pm 07:18 PM
The reasons for the installation of VS Code extensions may be: network instability, insufficient permissions, system compatibility issues, VS Code version is too old, antivirus software or firewall interference. By checking network connections, permissions, log files, updating VS Code, disabling security software, and restarting VS Code or computers, you can gradually troubleshoot and resolve issues.
 Detailed explanation of docker principle
Apr 14, 2025 pm 11:57 PM
Detailed explanation of docker principle
Apr 14, 2025 pm 11:57 PM
Docker uses Linux kernel features to provide an efficient and isolated application running environment. Its working principle is as follows: 1. The mirror is used as a read-only template, which contains everything you need to run the application; 2. The Union File System (UnionFS) stacks multiple file systems, only storing the differences, saving space and speeding up; 3. The daemon manages the mirrors and containers, and the client uses them for interaction; 4. Namespaces and cgroups implement container isolation and resource limitations; 5. Multiple network modes support container interconnection. Only by understanding these core concepts can you better utilize Docker.
 What is vscode What is vscode for?
Apr 15, 2025 pm 06:45 PM
What is vscode What is vscode for?
Apr 15, 2025 pm 06:45 PM
VS Code is the full name Visual Studio Code, which is a free and open source cross-platform code editor and development environment developed by Microsoft. It supports a wide range of programming languages and provides syntax highlighting, code automatic completion, code snippets and smart prompts to improve development efficiency. Through a rich extension ecosystem, users can add extensions to specific needs and languages, such as debuggers, code formatting tools, and Git integrations. VS Code also includes an intuitive debugger that helps quickly find and resolve bugs in your code.
