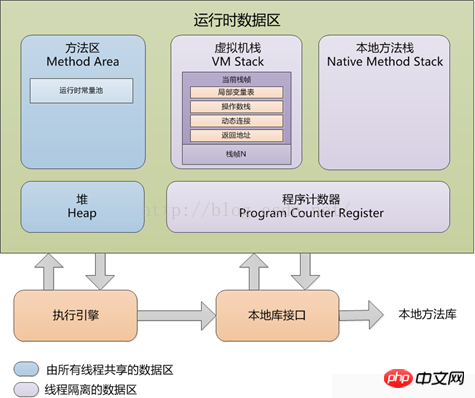
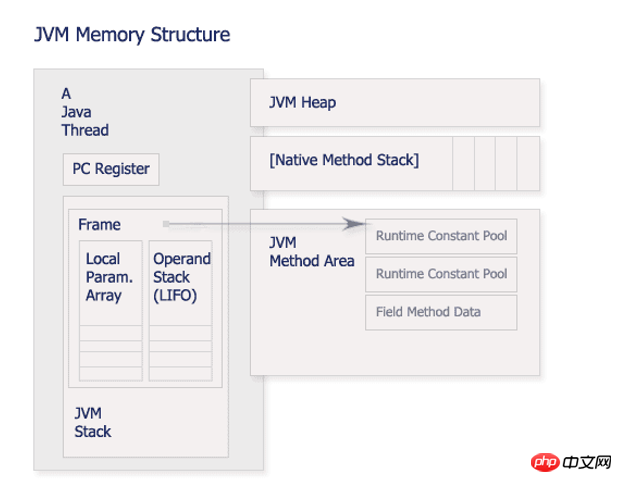
1. JVM memory model illustration
JVM Runtime Data Area (JVM Runtime Area) actually refers to the division and allocation of JVM memory space during the running of the JVM. Two pictures found on the Internet are as follows (I personally think that the second picture Native Method Stack should be drawn in the Java Thead module):


2. Introduction to each data area
1,Stackarea
The stack is divided into java virtual machine stack and local method stack
The key point is the Java virtual machine stack, which is private to the thread, and its life cycle is the same as the thread.
Each method execution will create a stack frame , which is used to store local variable tables, operation stacks, dynamic links, method exits , etc. . Each method is called until it is executed. Corresponds to the process of a stack frame from being pushed into the stack to being popped out of the stack in the virtual machine.
- The stack usually refers to the local variable table part, which stores the 8 basic data types known during compilation, as well as object references and instruction addresses. The local variable table is allocated during
compilation. When entering a method, the memory size allocated for local variables in this stack is determined.
- There will be two exceptions: StackOverFlowError and OutOfMemoneyError. When the thread request stack depth is greater than the depth allowed by the virtual machine, a StackOverFlowError error will be thrown; the virtual machine stack is dynamically expanded, and when the expansion cannot apply for enough memory space, an OutOfMemoneyError is thrown.
The local method stack serves the local methods used by the virtual machine (native) and is also thread-private.
2. Heap area
#The heap is shared by all threads and is created when the virtual machine starts , whose sole purpose is to store object instances.
- The heap area is the main area of gc. It is usually divided into two blocks, the young generation and the old generation. To be more detailed, the young generation is divided into the Eden area where newly created objects are placed. From survivor and To survivor save the objects that survived the gc. By default, each accounts for 8:1:1.
However, many articles introduce that it is divided into three blocks, and the method area is counted as the permanent generation. This is probably based on Hotspot virtual machine division, and for example, IBM j9 does not have an introduction to the permanent generation. No matter how partitioned, object instances are stored.
- There will be an exception OutOfMemoneyError
3. Method area
-
Shared by all threads, the area is used to store class information, constants, static variables and other data that have been loaded by the virtual machine. Described by the Java virtual machine as a logical part of the heap. It is customary to also call it permanent generation
Garbage collection rarely visits this area, but it also needs to be recycled, mainly for constant pool recycling and type unloading.
The constant pool is used to store various bytecodes and symbol references generated during compile time. The constant pool has a certain degree of dynamics, It can store constants generated during compilation; Constants during runtime can also be added to the constant pool, such as the intern() method of string.
4, Program counter
- The
line number executed by the current thread Indicator. Determine the next instruction by changing the value of the counter, such as loops, branches, jumps, exception handling, thread recovery, etc. all rely on counters to complete .
- Java virtual machine multi-threading is implemented by switching threads in turns and allocating processor execution time.
In order for thread switching to be restored to the correct position, each thread requires a independent program counter , so it is thread-private .
- The only block of Java virtual machine
No block that specifies any OutofMemoryError
3. Data area summary
Name |
##Features
|
Function
|
Configuration parameters
|
Exception
|
Program counter |
Occupies small memory, thread private, life cycle is the same as thread |
Roughly bytecode line number indicator
|
None |
None |
Virtual machine stack |
The thread is private, the life cycle is the same as the thread, Uses continuous memory space |
Memory model for Java method execution, storing local variable tables, operation stacks, dynamic links, method exits and other information
|
-Xss |
StackOverflowError
OutOfMemoryError
|
java heap |
Thread sharing, the life cycle is the same as the virtual machine , you can save object instances without using consecutive memory addresses |
, all object instances (including arrays) must be allocated on the heap |
-Xms
-Xsx
-Xmn
|
OutOfMemoryError |
Method area |
Thread sharing, the life cycle is the same as the virtual machine, you canDo not use continuous memory addresses |
Storage data such as class information, constants, static variables, and code compiled by the just-in-time compiler that have been loaded by the virtual machine
|
-XX:PermSize:16M
-XX:MaxPermSize:64M
|
OutOfMemoryError |
Runtime Constant Pool |
Part of the method area, dynamic |
Stores literals and symbol references |
|
|
4. Extension: Direct Memory
Direct Memory (Direct Memory) is not part of the virtual machine runtime data area , is not a memory area defined in the Java virtual machine specification, but this part of memory is also frequently used, and may also cause OutOfMemoryError exceptions, so we will explain it here.
The NIO (NewInput/Output) class was newly added to JDK 1.4, and an I/O method based on Channel and Buffer was introduced, which can be allocated directly using the Native function library Off-heap memory, and then operate through a DirectByteBuffer object stored in the Java heap as a reference to this memory. This can significantly improve performance in some scenarios because it avoids copying data back and forth between the Java heap and the Native heap.
5. Extension: Comparison of Heap and Stack
Some people often divide Java memory into heap memory (Heap) and stack memory (Stack). This division is relatively rough. Java memory area The division is actually far more complicated than this. The popularity of this division method only shows that the memory areas that most programmers pay most attention to and are most closely related to object memory allocation are these two areas.
The heap is flexible, but not safe. For objects, we need to create and destroy them dynamically. We cannot say that the objects created later are not destroyed, and the objects created previously cannot be destroyed. In that case, our program will be difficult to run, so the heap is used to store objects in Java. Once the object in the heap is destroyed, if we continue to reference this object, the famous NullPointerException will occur. This is the shortcoming of the heap - incorrect reference logic will only be discovered at runtime.
The stack is not flexible, but it is strict, safe, and easy to manage. Because as long as the upper reference is not destroyed, the lower reference must still be there. In most programs, variables and references defined first are pushed onto the stack, and those defined later are pushed onto the stack. At the same time, variables and references inside the block are stored in the entry area. When a block is pushed onto the stack, and when a block ends, it is popped off the stack. By understanding this mechanism, we can easily understand the concept of scope in various programming languages. At the same time, this is also the advantage of the stack - incorrect reference logic will be lost during compilation. can be discovered at any time.
Stack--mainly stores references and basic data types.
Heap--used to store object instances produced by new.
refer to:
The above is the detailed content of JVM memory model graphic example. For more information, please follow other related articles on the PHP Chinese website!


