 Java
Java
 javaTutorial
 Detailed explanation of JVM memory area division and garbage collection mechanism
Detailed explanation of JVM memory area division and garbage collection mechanism
When we write Java code, in most cases we don’t need to care whether or when your New object is released. Because there is an automatic garbage collection mechanism in the JVM. In the previous blog, we talked about the memory management methods of MRC (manual reference counting) and ARC (automatic reference counting) in Objective-C, as follows Review it. The current JVM memory recycling mechanism does not use reference counting, but mainly uses "copy recycling" and "adaptive recycling".
Of course, in addition to the above two algorithms, there are other algorithms, which will also be introduced below. In this blog, we will first briefly talk about JVM’s regional division, and then on this basis we will introduce the JVM’s garbage collection mechanism.
1. Brief description of JVM memory area division
Of course, this part will briefly talk about Let’s look at the division of the JVM’s memory area to pave the way for the expansion of the garbage collection mechanism below. Of course, there are a lot of detailed information on the division of JVM memory areas on the Internet, please Google it yourself.
According to the division of JVM memory area, I simply drew the diagram below. The area is mainly divided into two large blocks. One is the Heap area (Heap) . The New objects we create will be allocated in the heap area. The allocation method of malloc in C language is to obtain it from the Heap area. of. The garbage collector mainly recycles memory in the heap area.
The other part is non-heap area. The non-heap area mainly includes the "code cache area (Code Cache)" used to compile and save local code. The "Perm Gen" that saves the JVM's own static data, the "Java Virtual Machine Stack (JVM Stack) that stores references to method parameters, local variables, etc. and records the order of method calls. ” and “Local Method Stack (Local Method Stack)”.
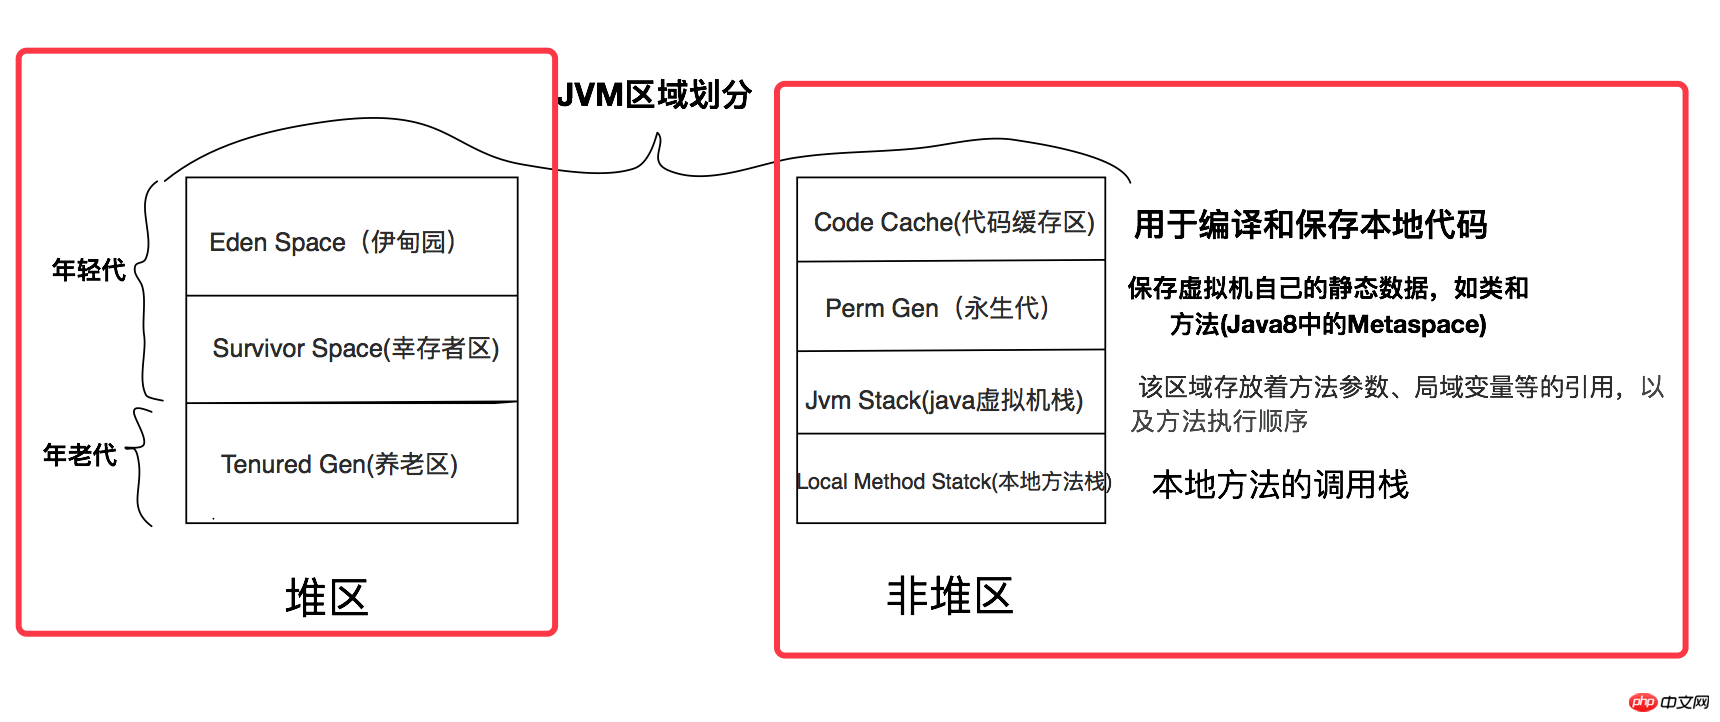
Young Generation" and "Old Generation" based on the survival time of the object memory or the size of the object. Objects in the "young generation" are unstableand prone to garbage, while objects in the "old generation" are relatively stable and less likely to generate garbage. The reason why they are separated is to divide and conquer. According to the characteristics of memory blocks in different areas, different memory recovery algorithms are adopted to improve the efficiency of garbage collection in the heap area. A detailed introduction will be given below.
2. Introduction to common memory recycling algorithms
We have a brief understanding of the aboveJVMThe division of memory areas, let’s take a look at several common memory recycling algorithms. Of course, the memory recycling algorithm introduced below is not only used in JVM, we will also review the memory recycling method in OC. The following mainly includes "reference counting recycling", "copy recycling", "marked sorting recycling", and "generational recycling".
1. Reference counting type memory recycling
Reference counting (Reference Count) type The memory recycling mechanism is the memory recycling mechanism currently used in the Objective-C and Swift languages. In previous blogs, we also talked about reference counting memory recycling in detail. As long as there is a reference, the reference count is increased by 1. When the reference count reaches 0, the block of memory will be recycled. Of course, this memory cleaning method can easily form a "reference cycle".
If circular references inObjective-C's reference count cause memory leak problems, variables can be declared as weak or strong types. In other words, we can define the reference as "strong reference" or "weak reference". When "strong reference cycle" appears, we can set one of the references to weak type, and then this strong reference cycle will be broken, and there will be no "Memory leak" problem. For more and more detailed information about "Reference Counted Memory Recycling", please refer to the related blogs published previously about OC content.
In order to understand more clearly how reference counting works, I simply drew the picture below. The three references a, b, and c in the stack on the left point to different area blocks in the heap. In a memory area block in the heap, when there is a strong reference to this area, its retainCount will be increased by 1. When weak reference, retainCount will not be increased by 1.
Let’s first take a look at the first memory area referenced by a. Because only a is strongly referenced in this memory block, retainCount=1. When a no longer refers to this memory area, retainCount=0, and the memory Will understand being recycled. In this case, there will be no memory leak.
Let’s take a look at the memory area 2 pointed to by b. Both b and memory block 3 have strong references to memory block 2, so 2's retainCount=2. Memory block 2 also has a strong reference to memory block 3, so 3's retainCount=1. Therefore, there is a "strong reference cycle" in the memory area pointed to by b, because when b no longer points to this memory area, rc=2 will become rc=1. Because retainCount is not zero, these two memory areas will not be released, and 2 will not be released, so naturally the three memory areas will not be released, but this memory area will not be used again. , so it will cause a "memory leak" situation. If these two memory areas are particularly large, then we can imagine that the consequences will be serious.
This situation like c reference will not cause "strong reference cycle" because one of the reference chains is a weak reference. When c no longer refers to the fourth block of memory, rc changes from 1 to zero, then the block area will be released immediately. After memory block 4 is released, the rc of memory block 5 changes from 1 to 0, and memory block 5 will also be released. In this case, memory leaks will not occur. In Objective-C, this method is used to recycle memory. Of course, in OC, in addition to "strong reference" and "weak reference", there is also an automatic release pool. In other words, the reference of the Autorealease type will not be released immediately when retainCount = 0, but will be released when it comes out of the automatic release pool. I will not go into details here.

2. Copy memory recycling
After talking about reference counting recycling , We know that reference counting can easily cause "cyclic reference" problems. In order to solve the memory leak problem caused by "cyclic reference", the concepts of "strong reference" and "weak reference" are introduced in OC. Next we will look at the copy memory recycling mechanism. In this mechanism, there is no need to worry about the issue of "cyclic references". Simply put, the core of copy-based recycling is "copying", but the premise is conditional copying. During garbage collection, the "live objects" are copied to another empty heap area, and then the previous area is cleared together. "Live objects" refer to objects that can be reached on the "stack" along the object's reference chain. Of course, after copying the live object to the new "heap area", the reference to the stack area must also be modified.
The following is a simplified diagram of the copy-type recycling we drew. It mainly divides the heap into two parts. During garbage collection, live objects on one heap will be copied to another heap. The heap 1 area below is the block currently in use, and the heap area 2 is the free area. The unmarked memory blocks in heap area 1, that is, 2 and 3, are garbage objects to be recycled. And 1, 4, and 5 are "living objects" to be copied. Because block 1 can be reached along a on the stack, and blocks 4 and 5 can be reached along c. Although blocks 2 and 3 have references, they do not come from non-heap area, that is, the references of blocks 2 and 3 are both references from the heap area, so they are objects to be recycled.

After finding the live object, the next thing to do is to copy the live object and copy it to the heap 2 area. Of course, the memory addresses between objects copied to heap area 2 are consecutive. If you want to allocate new memory space, you can allocate it directly from a free section of the heap. This is more efficient when allocating memory space. After the object is copied, the reference address from the "non-heap area" needs to be modified. As follows.

After the copying is completed, we can directly recycle all the memory space in the heap area 2. The following is the final result after copying and recycling. After the lower heap area 1 is cleared, the copied objects can be received. When garbage collection is performed on the heap area 2, the live objects in the heap area 2 will be copied to the heap area 1.
From this example, we can see that when there is a lot of memory garbage, the efficiency of "copy" garbage collection is still relatively high, because there are fewer copied objects, and the old heap space can be cleaned directly when clearing. . However, when there is relatively little garbage, this method will copy a large number of live objects, and the efficiency is still relatively low. This method will also divide the heap storage space in half. In other words, half of it is always free, and the utilization rate of the heap space is not high.

3. Mark-compression recovery algorithm
From the above "Copy"In the garbage collection process, we know that when there is a lot of garbage, the efficiency is relatively high, but when there is little garbage, the efficiency of its working method is relatively low. So, next, we will introduce another mark-compression recovery algorithm. This algorithm has a higher working efficiency when there is less garbage, but when there is a lot of garbage, the working efficiency is not high. This is the same as " copy Formula " forms a complement. Below we will introduce the mark-compression recycling algorithm.
Marking - The first part of compression is marking, which requires marking the "live objects" in the heap area. We have already talked about what a "living object" is in the above content, so we won't go into details here. From the characteristics of "live objects" we can see that the live objects below are memory areas 1 and 3, so we mark them.

After the marking is completed, we start to compress, compress the live objects into a section of the "heap area", and then clear the remaining parts. Below is the compression of the two living objects 1 and 3. After compression, clean the space below. In other words, in the Clean part, new objects can be allocated.

The screenshot below is the state after mark-compression and cleaning. Marked-compressed garbage collection can make full use of the space in the heap area. When there is relatively little garbage, this processing method is relatively efficient. If there is too much garbage and serious fragmentation, more "live objects" are moved, and the efficiency is relatively low. . This method can be used in conjunction with "copy" to select which recycling method is based on the garbage status of the current heap area. It exactly complements the advantages of "copy". The algorithm that integrates the "copy" and "mark-compression" recycling methods is the "generational" garbage collection mechanism, which will be introduced in detail below.

4. Generational garbage collection
" Generation " means dividing objects into different generations based on their garbage-prone state or object size, which can be divided into "young generation", "old generation" and "permanent generation". The "permanent generation" is not in the heap, so we won't discuss it again. Based on the characteristics of generational garbage collection, the following simplified diagram is drawn.
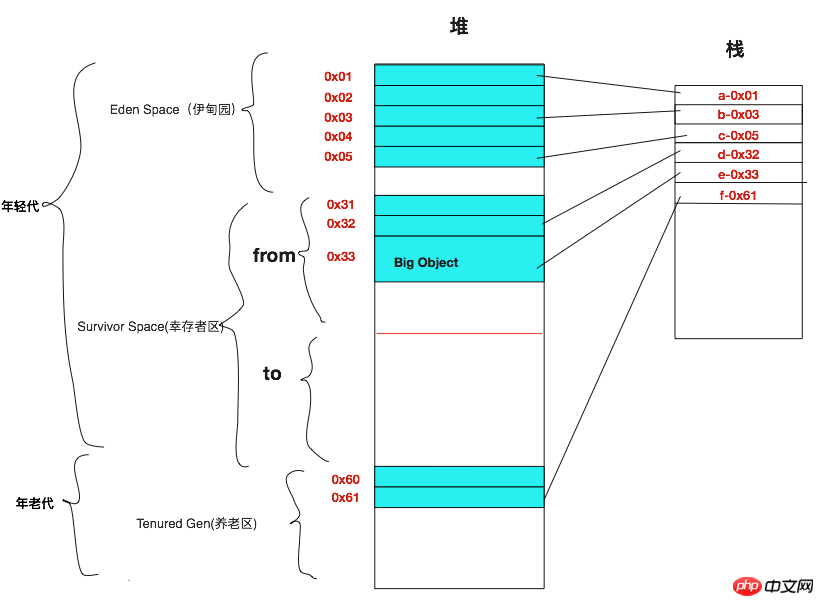
In the heap, the areas are mainly divided into "young generation" and "old generation". The memory of objects located in the "young generation" does not take long to create, is updated relatively quickly, and is prone to "memory garbage". Therefore, the "copy" recycling method for garbage collection in the "young generation" is more efficient. The "young generation" can be divided into two areas, one is Eden Space (Eden Garden) and Survivor Sprace (survivor area). Eden Space mainly stores objects that are created for the first time, while Survivor Sprace stores the "live objects" that survived Eden Space. The Survivor Sprace (survivor area) is divided into two blocks: form and to, which are used to copy objects to each other for garbage cleaning.
The "old generation" stores some "large objects" and "objects" that survived Survivor Sprace. Generally, the objects in the "old generation" are relatively stable. , generating less garbage. In this case, it is more efficient to use the "mark-compression" recycling method. "Generational garbage collection" mainly divides and conquers, classifying different objects according to their characteristics, and selecting appropriate garbage collection solutions based on the characteristics of the classification.

3. The specific working principle of generational garbage collection
Of course, in the specific garbage collection of JVM, according to threads, it can be divided into "serial garbage collection" that uses a single thread to collect, and "parallel garbage collection# that uses multiple threads to collect. ##". According to the suspension status of the program, it can be divided into "exclusive recycling" and "concurrent recycling". Of course, we have talked about it many times before. "Parallel" and "concurrency" are definitely not the same concepts, and they must not be confused. This blog will not elaborate on the above methods. If you are interested, please Google them.
Let's take a look at the complete steps of the specific working principle of "generational garbage collection" to intuitively feel the execution method of "generational" garbage collection.1. Before garbage collection
The picture below is waiting for "Generational garbage collection "From the picture below, we can see that some allocated object memory in the heap is not referenced on the stack. These are the objects to be recycled. We can see that the heap below is divided into "young generation" and "old generation" as a whole, and the young generation can be subdivided into three areas: Eden Space, From and To. Regarding the role of each area, we have already introduced it when introducing "generational garbage collection" above, so we will not introduce it in detail in this part.
2. Generational garbage collection
The following figure is a summary of the above The garbage collection process of the heap control. As we can see from the picture above, the To area is a blank area and can accept copied objects. Since the "young generation" is prone to generating memory garbage, a "copy" memory recycling method is adopted. We copy the "live objects" in the two heap blocksEden Space and From to the To area. While copying, we also need to modify the stack reference address of the copied memory. The "large object" storage space in the From or Eden area is directly copied to the "old generation". Because the efficiency of multiple copies of "large objects" in the From and To areas is relatively low, directly add them to the "old generation" to improve recycling efficiency.
For "old generation" garbage collection, "mark-compression" garbage collection is used. First, the living objects are "marked".
3. The result after garbage collection
Below is the "Category" Generation" specific results after garbage collection. From the diagram below, we can see that the live objects in Eden Space and From are copied to the To area, and the storage space of the "old generation" heap area has also changed a lot. Moreover, there are more large objects copied from the From area in the "old generation". The details are as follows.
4. Eclipse GC log configuration and analysis
So much has been said above, let’s intuitively feel how to view the garbage collection process and analyze the log information of garbage collection in Eclipse. By default, the garbage collection process and log printing are not displayed. You need to add relevant configuration items in the running configuration to print the garbage collection log. In this section, we take a look at the configuration of garbage collection logging inEclipse, and then we analyze these log records. Of course, we use Java8 in this blog. If you use other versions of Java, the log information printed out will be slightly different, so let’s start with this part.
1. Configure the run settings of Eclipse
Add the corresponding configuration items in the run settings of Eclipse, which will be printed only during garbage collection. Corresponding log information. Select our project, and then find theRun Configurations... option to perform runtime configuration.

Below is the dialog box opened by the above option, then find the (x)=Arguments tab bar, add the corresponding virtual machine parameters in VM arguments, these parameters will be used as Project parameters at runtime. Below we have added two parameters -XX:+PrintGCTimeStamps and -XX:+PrintGCDetails. From these two parameter names, it is not difficult to see the functions corresponding to the corresponding parameters. One is to print the timestamp of garbage collection, and the other is to print the details of garbage collection. Of course, there are many other parameters, such as the parameters of the specific algorithm when selecting "garbage collection", the parameters of whether to choose "serial" or "parallel", and some choices of "exclusive" or "concurrent" garbage. Recycled parameters. I won’t go into too much detail here, please Google it yourself.

2. Printing and parsing of recycling logs
After configuring the above After the parameters, when we use System.gc(); to force garbage collection, the corresponding parameter information will be printed out. First we have to create the code for testing. Below is the test class we created. Of course, the code in the test class is relatively simple. The main thing is to new the string, then set the reference to null, and finally call System.gc() for recycling. The specific code is as follows:
package com.zeluli.gclog;public class GCLogTest {public static void main(String[] args) {
        String s = new String("Value");
        s = null;
        System.gc();
    }
}
The following is the effect of the above code. Next, we will introduce the main content of the log information below.
##[PSYoungGen: 1997K->416K(38400K)] 1997K->424K(125952K), 0.0010277 secs]
- PSYoungGen means that the "young generation" is recycled in parallel. 1997K->416K means "before recycling->after recycling" in the corresponding area of the young generation. " size, while (38400K) represents the total size of the "young generation" heap. The 1997K->424K (125952K) data at the back is a problem viewed from the perspective of the entire heap. 1997K (memory used before heap recycling) -> 424K (memory used after heap recycling) (125952K - the total memory space of the heap).
- #[ParOldGen: 8K->328K(87552K)]
-
## means The recycling situation of the "metadata area", the Metaspace and the "permanent generation" area, which are areas used to store static data or system methods.
- ParOldGen recycles the "old generation" in parallel. The following parameters are similar to the parameters for parallel recycle of the young generation mentioned above, so I won't go into details.
 The above is a simple garbage collection log. The content of this blog will stop here first. There is a lot more information about garbage collection in the JVM. I will introduce it one after another based on the specific situation in the future. That’s it for today’s blog.
The above is the detailed content of Detailed explanation of JVM memory area division and garbage collection mechanism. For more information, please follow other related articles on the PHP Chinese website!

Hot AI Tools

Undresser.AI Undress
AI-powered app for creating realistic nude photos

AI Clothes Remover
Online AI tool for removing clothes from photos.

Undress AI Tool
Undress images for free

Clothoff.io
AI clothes remover

AI Hentai Generator
Generate AI Hentai for free.

Hot Article

Hot Tools

Notepad++7.3.1
Easy-to-use and free code editor

SublimeText3 Chinese version
Chinese version, very easy to use

Zend Studio 13.0.1
Powerful PHP integrated development environment

Dreamweaver CS6
Visual web development tools

SublimeText3 Mac version
God-level code editing software (SublimeText3)

Hot Topics
 Printer has insufficient memory and cannot print the page Excel or PowerPoint error
Feb 19, 2024 pm 05:45 PM
If you encounter the problem of insufficient printer memory when printing Excel worksheets or PowerPoint presentations, this article may be helpful to you. You may receive a similar error message stating that the printer does not have enough memory to print the page. However, there are some suggestions you can follow to resolve this issue. Why is printer memory unavailable when printing? Insufficient printer memory may cause a memory not available error. Sometimes it's because the printer driver settings are too low, but it can also be for other reasons. Large file size Printer driver Outdated or corrupt Interruption from installed add-ons Misconfiguration of printer settings This issue may also occur because of low memory settings on the Microsoft Windows printer driver. Repair printing
 Large memory optimization, what should I do if the computer upgrades to 16g/32g memory speed and there is no change?
Jun 18, 2024 pm 06:51 PM
For mechanical hard drives or SATA solid-state drives, you will feel the increase in software running speed. If it is an NVME hard drive, you may not feel it. 1. Import the registry into the desktop and create a new text document, copy and paste the following content, save it as 1.reg, then right-click to merge and restart the computer. WindowsRegistryEditorVersion5.00[HKEY_LOCAL_MACHINE\SYSTEM\CurrentControlSet\Control\SessionManager\MemoryManagement]"DisablePagingExecutive"=d
 How to check memory usage on Xiaomi Mi 14Pro?
Mar 18, 2024 pm 02:19 PM
Recently, Xiaomi released a powerful high-end smartphone Xiaomi 14Pro, which not only has a stylish design, but also has internal and external black technology. The phone has top performance and excellent multitasking capabilities, allowing users to enjoy a fast and smooth mobile phone experience. However, performance will also be affected by memory. Many users want to know how to check the memory usage of Xiaomi 14Pro, so let’s take a look. How to check memory usage on Xiaomi Mi 14Pro? Introduction to how to check the memory usage of Xiaomi 14Pro. Open the [Application Management] button in [Settings] of Xiaomi 14Pro phone. To view the list of all installed apps, browse the list and find the app you want to view, click on it to enter the app details page. In the application details page
![Windows input encounters hang or high memory usage [Fix]](https://img.php.cn/upload/article/000/887/227/170835409686241.jpg?x-oss-process=image/resize,m_fill,h_207,w_330) Windows input encounters hang or high memory usage [Fix]
Feb 19, 2024 pm 10:48 PM
Windows input encounters hang or high memory usage [Fix]
Feb 19, 2024 pm 10:48 PM
The Windows input experience is a key system service responsible for processing user input from various human interface devices. It starts automatically at system startup and runs in the background. However, sometimes this service may automatically hang or occupy too much memory, resulting in reduced system performance. Therefore, it is crucial to monitor and manage this process in a timely manner to ensure system efficiency and stability. In this article, we will share how to fix issues where the Windows input experience hangs or causes high memory usage. The Windows Input Experience Service does not have a user interface, but it is closely related to handling basic system tasks and functions related to input devices. Its role is to help the Windows system understand every input entered by the user.
 Is there a big difference between 8g and 16g memory in computers? (Choose 8g or 16g of computer memory)
Mar 13, 2024 pm 06:10 PM
When novice users buy a computer, they will be curious about the difference between 8g and 16g computer memory? Should I choose 8g or 16g? In response to this problem, today the editor will explain it to you in detail. Is there a big difference between 8g and 16g of computer memory? 1. For ordinary families or ordinary work, 8G running memory can meet the requirements, so there is not much difference between 8g and 16g during use. 2. When used by game enthusiasts, currently large-scale games basically start at 6g, and 8g is the minimum standard. Currently, when the screen is 2k, higher resolution will not bring higher frame rate performance, so there is no big difference between 8g and 16g. 3. For audio and video editing users, there will be obvious differences between 8g and 16g.
 Samsung announced the completion of 16-layer hybrid bonding stacking process technology verification, which is expected to be widely used in HBM4 memory
Apr 07, 2024 pm 09:19 PM
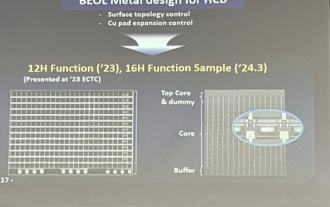
According to the report, Samsung Electronics executive Dae Woo Kim said that at the 2024 Korean Microelectronics and Packaging Society Annual Meeting, Samsung Electronics will complete the verification of the 16-layer hybrid bonding HBM memory technology. It is reported that this technology has passed technical verification. The report also stated that this technical verification will lay the foundation for the development of the memory market in the next few years. DaeWooKim said that Samsung Electronics has successfully manufactured a 16-layer stacked HBM3 memory based on hybrid bonding technology. The memory sample works normally. In the future, the 16-layer stacked hybrid bonding technology will be used for mass production of HBM4 memory. ▲Image source TheElec, same as below. Compared with the existing bonding process, hybrid bonding does not need to add bumps between DRAM memory layers, but directly connects the upper and lower layers copper to copper.
 Micron: HBM memory consumes 3 times the wafer volume, and production capacity is basically booked for next year
Mar 22, 2024 pm 08:16 PM
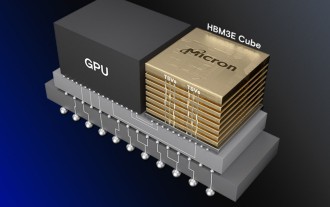
This site reported on March 21 that Micron held a conference call after releasing its quarterly financial report. At the conference, Micron CEO Sanjay Mehrotra said that compared to traditional memory, HBM consumes significantly more wafers. Micron said that when producing the same capacity at the same node, the current most advanced HBM3E memory consumes three times more wafers than standard DDR5, and it is expected that as performance improves and packaging complexity intensifies, in the future HBM4 This ratio will further increase. Referring to previous reports on this site, this high ratio is partly due to HBM’s low yield rate. HBM memory is stacked with multi-layer DRAM memory TSV connections. A problem with one layer means that the entire
 Lexar launches Ares Wings of War DDR5 7600 16GB x2 memory kit: Hynix A-die particles, 1,299 yuan
May 07, 2024 am 08:13 AM
According to news from this website on May 6, Lexar launched the Ares Wings of War series DDR57600CL36 overclocking memory. The 16GBx2 set will be available for pre-sale at 0:00 on May 7 with a deposit of 50 yuan, and the price is 1,299 yuan. Lexar Wings of War memory uses Hynix A-die memory chips, supports Intel XMP3.0, and provides the following two overclocking presets: 7600MT/s: CL36-46-46-961.4V8000MT/s: CL38-48-49 -1001.45V In terms of heat dissipation, this memory set is equipped with a 1.8mm thick all-aluminum heat dissipation vest and is equipped with PMIC's exclusive thermal conductive silicone grease pad. The memory uses 8 high-brightness LED beads and supports 13 RGB lighting modes.


