
 Backend Development
Python Tutorial
Detailed explanation of examples of drawing graphics with python
Backend Development
Python Tutorial
Detailed explanation of examples of drawing graphics with python
Detailed explanation of examples of drawing graphics with python

1. Environment
System: windows10
python version: python3.6.1
Libraries used: matplotlib, numpy
2. Several ways for the numpy library to generate random numbers
numpy.random##random_integers(low,high,size)
1
import numpyasnpCopy after login
rand(d0, d1 , ..., dn) In [2]: x=np.random.rand(2,5)
In [3]: x
Out[3 ]:
array([[ 0.84286554, 0.50007593, 0.66500549, 0.97387807, 0.03993009],
[ 0.46391661, 0.50717355, 0.21527461 , 0.92692517, 0.2567891 ]])randn(d0, d1, ..., dn) query result is standard normal distribution
In [4]: x=np.random.randn(2, 5)
In [5]: x
Out[5]:
array([[-0.77195196, 0.26651203, -0.35045793, -0.0210377, 0.89749635],
[-0.20229338, 1.44 852833 , -0.10858996, -1.65034606, -0.39793635]])randint(low,high,size) Generate between low and high (Half-open interval [low, high)), size data
In [6]: x=np.random.randint(1,8,4)
In [7]: x
Out[7]: array([4, 4, 2, 7])Generate size data between low and high (closed interval [low, high))In [10]: x=np.random.random_integers(2,10,5)In [11]: x Out[11]: array([7, 4, 5, 4, 2])
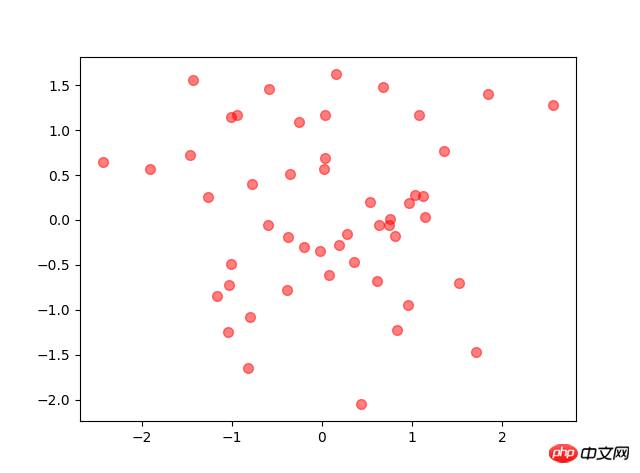
3.Scatter chart
1 2 3 4 5 6 |
|
1 2 3 4 5 |
|
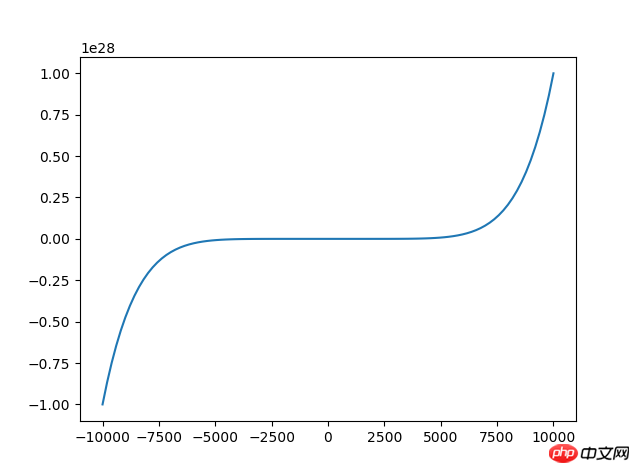
##4. Line chart
1 2 3 4 |
|
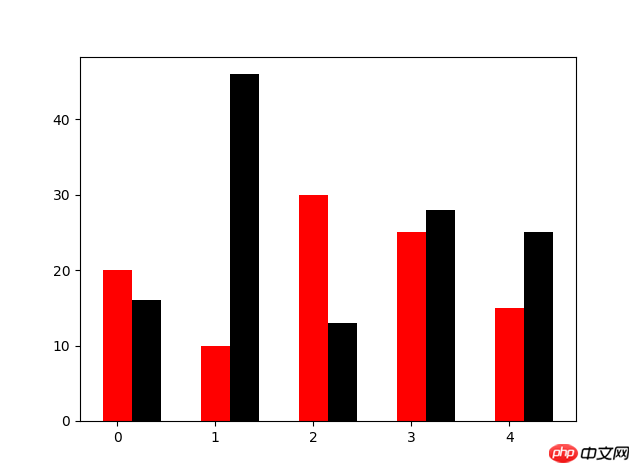
5. Bar chart
1 2 3 4 5 6 7 8 |
|
orientation set horizontal bar chart
1
2
3
4
5
6
7
N=5
y=[20,10,30,25,15]
y1=np.random.randint(10,50,5)
x=np.random.randint(10,1000,N)
index=np.arange(N)# plt.bar(left=index,height=y,color='red',width=0.3)# plt.bar(left=index+0.3,height=y1,color='black',width=0.3)#plt.barh() 加了h就是横向的条形图,不用设置orientation
plt.bar(left=0,bottom=index,width=y,color='red',height=0.5,orientation='horizontal')
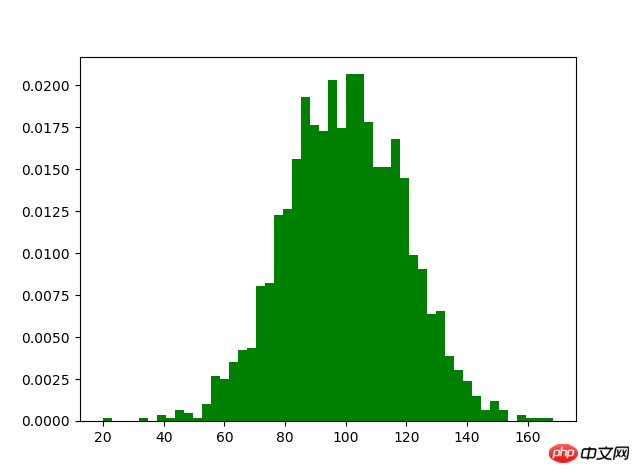
plt.show()Copy after login##6. Histogram
 orientation set horizontal bar chart
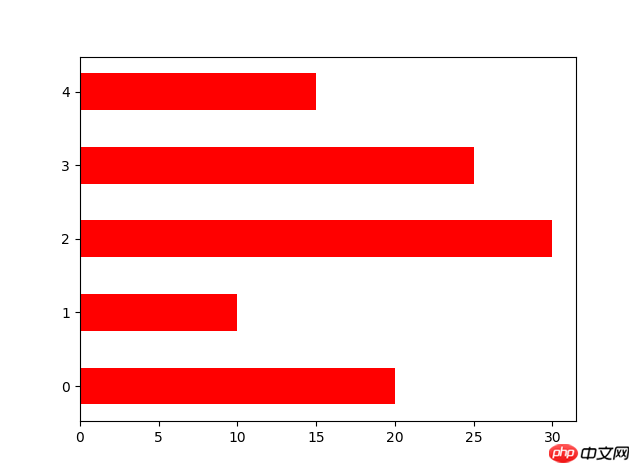
1 2 3 4 5 |
|
1
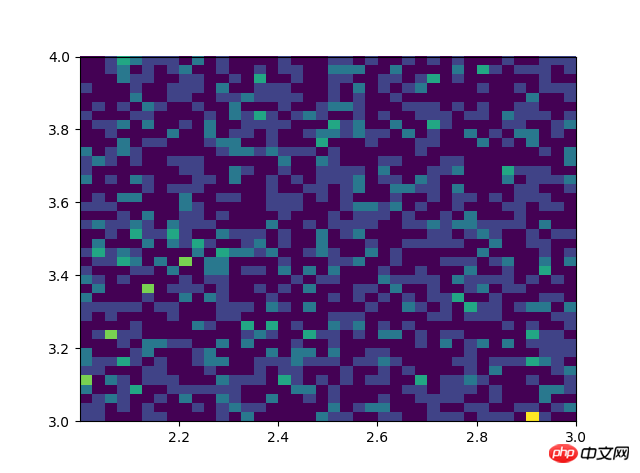
# #双变量的直方图# #颜色越深频率越高# #研究双变量的联合分布Copy after login
1
2
3
4
5
#双变量的直方图#颜色越深频率越高#研究双变量的联合分布
x=np.random.rand(1000)+2
y=np.random.rand(1000)+3
plt.hist2d(x,y,bins=40)
plt.show()Copy after login
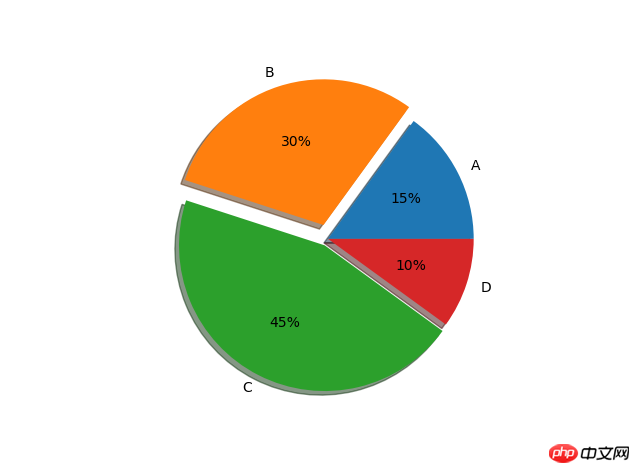
7. Pie Chart
1 |
|
1 |
|
1 2 3 4 5 6 |
|
8. Box plot
1 |
|
1 |
|
The above is the detailed content of Detailed explanation of examples of drawing graphics with python. For more information, please follow other related articles on the PHP Chinese website!
Hot AI Tools

Undresser.AI Undress
AI-powered app for creating realistic nude photos

AI Clothes Remover
Online AI tool for removing clothes from photos.

Undress AI Tool
Undress images for free

Clothoff.io
AI clothes remover

Video Face Swap
Swap faces in any video effortlessly with our completely free AI face swap tool!
Hot Article
Hot Tools

Notepad++7.3.1
Easy-to-use and free code editor

SublimeText3 Chinese version
Chinese version, very easy to use

Zend Studio 13.0.1
Powerful PHP integrated development environment

Dreamweaver CS6
Visual web development tools

SublimeText3 Mac version
God-level code editing software (SublimeText3)
Hot Topics


 PHP and Python: Different Paradigms Explained
Apr 18, 2025 am 12:26 AM
PHP and Python: Different Paradigms Explained
Apr 18, 2025 am 12:26 AM
PHP is mainly procedural programming, but also supports object-oriented programming (OOP); Python supports a variety of paradigms, including OOP, functional and procedural programming. PHP is suitable for web development, and Python is suitable for a variety of applications such as data analysis and machine learning.
 Choosing Between PHP and Python: A Guide
Apr 18, 2025 am 12:24 AM
Choosing Between PHP and Python: A Guide
Apr 18, 2025 am 12:24 AM
PHP is suitable for web development and rapid prototyping, and Python is suitable for data science and machine learning. 1.PHP is used for dynamic web development, with simple syntax and suitable for rapid development. 2. Python has concise syntax, is suitable for multiple fields, and has a strong library ecosystem.
 Python vs. JavaScript: The Learning Curve and Ease of Use
Apr 16, 2025 am 12:12 AM
Python vs. JavaScript: The Learning Curve and Ease of Use
Apr 16, 2025 am 12:12 AM
Python is more suitable for beginners, with a smooth learning curve and concise syntax; JavaScript is suitable for front-end development, with a steep learning curve and flexible syntax. 1. Python syntax is intuitive and suitable for data science and back-end development. 2. JavaScript is flexible and widely used in front-end and server-side programming.
 Can vs code run in Windows 8
Apr 15, 2025 pm 07:24 PM
Can vs code run in Windows 8
Apr 15, 2025 pm 07:24 PM
VS Code can run on Windows 8, but the experience may not be great. First make sure the system has been updated to the latest patch, then download the VS Code installation package that matches the system architecture and install it as prompted. After installation, be aware that some extensions may be incompatible with Windows 8 and need to look for alternative extensions or use newer Windows systems in a virtual machine. Install the necessary extensions to check whether they work properly. Although VS Code is feasible on Windows 8, it is recommended to upgrade to a newer Windows system for a better development experience and security.
 Can visual studio code be used in python
Apr 15, 2025 pm 08:18 PM
Can visual studio code be used in python
Apr 15, 2025 pm 08:18 PM
VS Code can be used to write Python and provides many features that make it an ideal tool for developing Python applications. It allows users to: install Python extensions to get functions such as code completion, syntax highlighting, and debugging. Use the debugger to track code step by step, find and fix errors. Integrate Git for version control. Use code formatting tools to maintain code consistency. Use the Linting tool to spot potential problems ahead of time.
 PHP and Python: A Deep Dive into Their History
Apr 18, 2025 am 12:25 AM
PHP and Python: A Deep Dive into Their History
Apr 18, 2025 am 12:25 AM
PHP originated in 1994 and was developed by RasmusLerdorf. It was originally used to track website visitors and gradually evolved into a server-side scripting language and was widely used in web development. Python was developed by Guidovan Rossum in the late 1980s and was first released in 1991. It emphasizes code readability and simplicity, and is suitable for scientific computing, data analysis and other fields.
 How to run programs in terminal vscode
Apr 15, 2025 pm 06:42 PM
How to run programs in terminal vscode
Apr 15, 2025 pm 06:42 PM
In VS Code, you can run the program in the terminal through the following steps: Prepare the code and open the integrated terminal to ensure that the code directory is consistent with the terminal working directory. Select the run command according to the programming language (such as Python's python your_file_name.py) to check whether it runs successfully and resolve errors. Use the debugger to improve debugging efficiency.
 Is the vscode extension malicious?
Apr 15, 2025 pm 07:57 PM
Is the vscode extension malicious?
Apr 15, 2025 pm 07:57 PM
VS Code extensions pose malicious risks, such as hiding malicious code, exploiting vulnerabilities, and masturbating as legitimate extensions. Methods to identify malicious extensions include: checking publishers, reading comments, checking code, and installing with caution. Security measures also include: security awareness, good habits, regular updates and antivirus software.
