

Combining Gaode map + canvas drawing to realize a small project
A friend of mine commissioned a startup project before and wanted me to help. I happened to have some free time at that time, so I agreed half-heartedly.
After joining the team, I discovered that the front-end and back-end of the project were separated. The back-end engineer was already in place to mainly implement the interface, and the IOS-side engineer was also in place. There was still a web front-end engineer missing. A chill ran down my spine. Although I had written some js and css before, although I had some skills, I was still far from being a front-end engineer. After explaining the situation to my friend, my friend was bold and asked me to give it a try. The main reason was that he couldn't find anyone (it's also possible that the current quotes for front-end engineers are too expensive. When starting a business, you can save as much as you can. I understand... ), there is no other way, just take it one step at a time.
Other management pages are fine. The main Dashboard needs to draw the real-time position of the sprinkler machine and the fan-shaped area of the sprinkler sprinkler on the map based on longitude, latitude, radius, angle, etc.
Since I have never used Amap before, and I have never drawn pictures, when I first got this project, I was really confused. I had no choice but to immerse myself in studying the API of Amap. I found that there are some APIs for drawing circles, polylines, polygons, etc. Soon, based on the official demo provided by Amap, I quickly wrote the following code:

 ##
## 1 //开始绑定 2 for (var m = 0; m < deviceList.length; m++) { 3 var device = deviceList[m]; 4 var point = new AMap.LngLat(device.longitude, device.latitude);// 圆心位置; 5 6 var circle = new AMap.Circle({ 7 center: point,// 圆心位置 8 radius: device.radius, //半径 9 strokeColor: "white", //线颜色10 strokeOpacity: 1, //线透明度11 strokeWeight: 1, //线粗细度12 fillColor: "#6e97ce", //填充颜色13 fillOpacity: 0.9//填充透明度14 });15 16 17 circle.setMap(map);18 19 var marker = new AMap.Marker({20 map: map,21 position: [device.longitude, device.latitude],22 });23 24 //注册点击事件25 addClickHandler(circle, device);26 27 }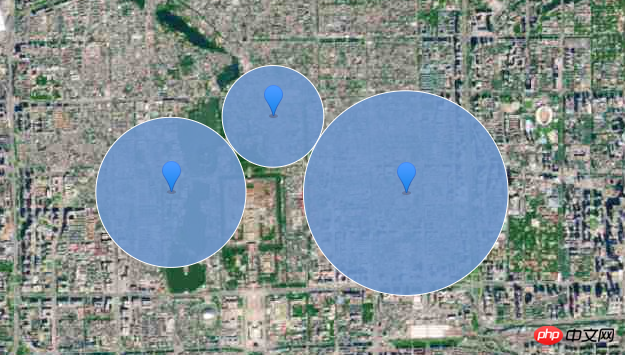


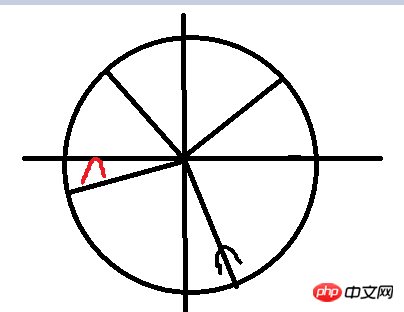
1 <div> 2 <canvas id="pie" width="300px" height="300px"></canvas> 3 </div> 4 <script> 5 var dom = document.getElementById("pie"); 6 var ctx = dom.getContext("2d"); 7 var width = ctx.canvas.width; 8 var height = ctx.canvas.height; 9 var r = width / 2; 10 var rem = width / 200; 11 12 13 function drawBackground() { 14 ctx.save(); 15 ctx.translate(r, r);//重新定义圆点到中心 16 ctx.beginPath(); 17 ctx.lineWidth = rem; 18 ctx.fillStyle = "#00AEE8"; 19 ctx.strokeStyle = "#fff"; 20 ctx.arc(0, 0, r, 0, Math.PI * 2, false);//圆点坐标,起始角0,结束角2π,顺时针 21 ctx.stroke(); 22 ctx.fill(); 23 } 24 25 function drawsector(sDeg,eDeg) { 26 //画扇形 27 ctx.beginPath(); 28 //定义起点 29 ctx.moveTo(0, 0); 30 ctx.fillStyle = "#0A73B1"; 31 //以起点为圆心,画一个半径为100的圆弧 32 ctx.arc(0, 0, r, sDeg * Math.PI / 180, eDeg * Math.PI / 180); 33 ctx.closePath(); 34 //ctx.stroke(); 35 ctx.fill(); 36 37 } 38 39 function drawtext(PDeg) { 40 //写文字 41 ctx.font = "18px Arial"; 42 ctx.textAlign = "center"; 43 ctx.textBaseline = "middle"; 44 ctx.strokeStyle = "black"; 45 ctx.fillStyle = "black"; 46 var rad = 90 * Math.PI / 180;//弧度 47 var x = (r - 30 * rem) * Math.cos(rad); 48 var y = (r - 30 * rem) * Math.sin(rad); 49 ctx.rotate((PDeg-90) * Math.PI / 180); 50 ctx.strokeText("<", x, y); 51 ctx.fillText("<", x, y); 52 53 } 54 55 function drawStart(rDeg) {//起始位置 56 ctx.save(); 57 ctx.beginPath(); 58 var rad = rDeg * Math.PI / 180;//弧度 59 var x = (r) * Math.cos(rad); 60 var y = (r) * Math.sin(rad); 61 62 ctx.strokeStyle = "black"; 63 ctx.lineWidth = 2*rem; 64 ctx.moveTo(0, 0); 65 ctx.lineTo(x, y); 66 ctx.lineCap = "round"; 67 ctx.stroke(); 68 ctx.restore(); 69 } 70 function drawPosition(PDeg) {//实时位置 71 ctx.save(); 72 ctx.beginPath(); 73 var rad = PDeg * Math.PI / 180 ; 74 //ctx.rotate(rad); 75 var x = (r) * Math.cos(rad); 76 var y = (r) * Math.sin(rad); 77 78 ctx.strokeStyle = "#fff"; 79 80 ctx.lineWidth = 3 * rem; 81 ctx.moveTo(0, 0); 82 ctx.lineTo(x, y); 83 ctx.lineCap = "round"; 84 ctx.stroke(); 85 86 ctx.restore(); 87 } 88 89 function drawPause() {//暂停 90 ctx.save(); 91 ctx.beginPath(); 92 var rad = 120 * Math.PI / 180; 93 //ctx.rotate(rad); 94 var x = (r) * Math.cos(rad); 95 var y = (r) * Math.sin(rad); 96 97 ctx.strokeStyle = "#fff"; 98 99 ctx.lineWidth = 10 * rem;100 ctx.moveTo(x+30, -y+80);101 ctx.lineTo(x+30, y-80);102 ctx.lineCap = "round";103 ctx.stroke();104 105 ctx.restore();106 107 108 ctx.save();109 ctx.beginPath();110 var rad = 60 * Math.PI / 180;111 112 var x2 = (r) * Math.cos(rad);113 var y2 = (r) * Math.sin(rad);114 115 ctx.strokeStyle = "#fff";116 117 ctx.lineWidth = 10 * rem;118 ctx.moveTo(x2-30, -y2+80);119 ctx.lineTo(x2-30, y2-80);120 ctx.lineCap = "round";121 ctx.stroke();122 123 ctx.restore();124 }125 function draw() {126 ctx.clearRect(0, 0, width, height);127 drawBackground();//背景128 drawsector(50, 180);129 130 //drawPause();131 132 drawStart(50);133 drawPosition(100);134 drawtext(110);135 ctx.restore();136 }137 138 139 draw();140 </script>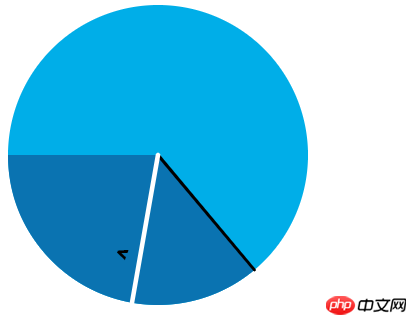
The above is the detailed content of Combining Gaode map + canvas drawing to realize a small project. For more information, please follow other related articles on the PHP Chinese website!

Hot AI Tools

Undresser.AI Undress
AI-powered app for creating realistic nude photos

AI Clothes Remover
Online AI tool for removing clothes from photos.

Undress AI Tool
Undress images for free

Clothoff.io
AI clothes remover

AI Hentai Generator
Generate AI Hentai for free.

Hot Article
Hot Tools

Notepad++7.3.1
Easy-to-use and free code editor

SublimeText3 Chinese version
Chinese version, very easy to use

Zend Studio 13.0.1
Powerful PHP integrated development environment

Dreamweaver CS6
Visual web development tools

SublimeText3 Mac version
God-level code editing software (SublimeText3)
Hot Topics
 1381
1381
 52
52

 How to make Google Maps the default map in iPhone
Apr 17, 2024 pm 07:34 PM
How to make Google Maps the default map in iPhone
Apr 17, 2024 pm 07:34 PM
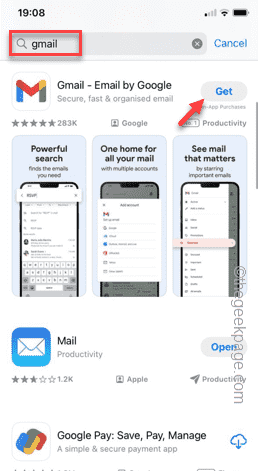
The default map on the iPhone is Maps, Apple's proprietary geolocation provider. Although the map is getting better, it doesn't work well outside the United States. It has nothing to offer compared to Google Maps. In this article, we discuss the feasible steps to use Google Maps to become the default map on your iPhone. How to Make Google Maps the Default Map in iPhone Setting Google Maps as the default map app on your phone is easier than you think. Follow the steps below – Prerequisite steps – You must have Gmail installed on your phone. Step 1 – Open the AppStore. Step 2 – Search for “Gmail”. Step 3 – Click next to Gmail app
 How to use map and location functions in uniapp
Oct 16, 2023 am 08:01 AM
How to use map and location functions in uniapp
Oct 16, 2023 am 08:01 AM
How to use map and positioning functions in uniapp 1. Background introduction With the popularity of mobile applications and the rapid development of positioning technology, map and positioning functions have become an indispensable part of modern mobile applications. uniapp is a cross-platform application development framework developed based on Vue.js, which can facilitate developers to share code on multiple platforms. This article will introduce how to use maps and positioning functions in uniapp and provide specific code examples. 2. Use the uniapp-amap component to implement the map function
 How to add store address to Xiaohongshu map? How to fill in the store address setting?
Mar 29, 2024 am 09:41 AM
How to add store address to Xiaohongshu map? How to fill in the store address setting?
Mar 29, 2024 am 09:41 AM
As Xiaohongshu becomes more and more popular among young people, more and more people choose to open stores on Xiaohongshu. Many novice sellers encounter difficulties when setting up their store address and do not know how to add the store address to the map. 1. How to add the store address to the map in Xiaohongshu? 1. First, make sure your store has a registered account on Xiaohongshu and has successfully opened a store. 2. Log in to your Xiaohongshu account, enter the store backend, and find the "Store Settings" option. 3. On the store settings page, find the "Store Address" column and click "Add Address". 4. In the address adding page that pops up, fill in the detailed address information of the store, including province, city, district, county, street, house number, etc. 5. After filling in, click the "Confirm Add" button. Xiaohongshu will provide you with the address
 How to create a map heat map using Highcharts
Dec 17, 2023 pm 04:06 PM
How to create a map heat map using Highcharts
Dec 17, 2023 pm 04:06 PM
How to use Highcharts to create a map heat map requires specific code examples. A heat map is a visual data display method that can represent the data distribution in each area through different color shades. In the field of data visualization, Highcharts is a very popular JavaScript library that provides rich chart types and interactive functions. This article will introduce how to use Highcharts to create a map heat map and provide specific code examples. First, we need to prepare some data
 How to use at-a-glance directions on Google Maps
Jun 13, 2024 pm 09:40 PM
How to use at-a-glance directions on Google Maps
Jun 13, 2024 pm 09:40 PM
A year after its launch, Google Maps has launched a new feature. Once you set a route to your destination on the map, it summarizes your travel route. Once your journey begins, you can "Browse" route guidance from your phone's lock screen. You can use Google Maps to see your estimated arrival time and route. Throughout your trip, you can view navigation information on your lock screen, and by unlocking your phone, you can view navigation information without accessing Google Maps. By unlocking your phone, you can view navigation information without accessing Google Maps. By unlocking your phone, you can view navigation information without accessing Google Maps. By unlocking your phone, you can view navigation information without accessing Google Maps. By unlocking your phone, you can view navigation information without accessing Google Maps. By unlocking your phone, you can view navigation information without accessing Google Maps.
 Learn the canvas framework and explain the commonly used canvas framework in detail
Jan 17, 2024 am 11:03 AM
Learn the canvas framework and explain the commonly used canvas framework in detail
Jan 17, 2024 am 11:03 AM
Explore the Canvas framework: To understand what are the commonly used Canvas frameworks, specific code examples are required. Introduction: Canvas is a drawing API provided in HTML5, through which we can achieve rich graphics and animation effects. In order to improve the efficiency and convenience of drawing, many developers have developed different Canvas frameworks. This article will introduce some commonly used Canvas frameworks and provide specific code examples to help readers gain a deeper understanding of how to use these frameworks. 1. EaselJS framework Ea
 uniapp implements how to use canvas to draw charts and animation effects
Oct 18, 2023 am 10:42 AM
uniapp implements how to use canvas to draw charts and animation effects
Oct 18, 2023 am 10:42 AM
How to use canvas to draw charts and animation effects in uniapp requires specific code examples 1. Introduction With the popularity of mobile devices, more and more applications need to display various charts and animation effects on the mobile terminal. As a cross-platform development framework based on Vue.js, uniapp provides the ability to use canvas to draw charts and animation effects. This article will introduce how uniapp uses canvas to achieve chart and animation effects, and give specific code examples. 2. canvas
 Cloud-based and car-based MapNeXt is all done! Construction of next-generation online high-precision maps
Jan 31, 2024 pm 06:06 PM
Cloud-based and car-based MapNeXt is all done! Construction of next-generation online high-precision maps
Jan 31, 2024 pm 06:06 PM
Written above & the author’s personal understanding In collaborative, connected and automated mobility (CCAM), the stronger the ability of intelligent driving vehicles to perceive, model and analyze the surrounding environment, the more aware and able they are to understand and make decisions , as well as perform complex driving scenarios safely and efficiently. High-precision (HD) maps represent road environments with centimeter-level accuracy and lane-level semantic information, making them a core component of intelligent mobility systems and a key enabler of CCAM technology. These maps provide automated vehicles with a powerful advantage in understanding their surroundings. HD maps are also considered hidden or virtual sensors because they bring together knowledge from physical sensors (maps), namely lidar, cameras, GPS and IMU, to build a model of the road environment. HD map
