

Detailed explanation of big data processing in Python

Share

Knowledge points:
lubridate package disassembly time | POSIXlt
Use decision tree classification and random forest prediction
Use logarithms for fit and exp function to restore
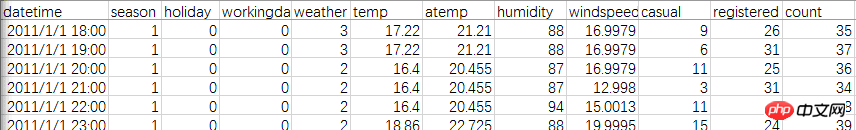
The training set comes from the bicycle rental data in the Kaggle Washington Bicycle Sharing Program, and analyzes the relationship between shared bicycles, weather, time, etc. The data set has a total of 11 variables and more than 10,000 rows of data.
First of all, let’s take a look at the official data. There are two tables, both with data from 2011-2012. The difference is that the Test file has all the dates of each month, but it is not registered. users and random users. The Train file only has 1-20 days per month, but there are two types of users.
Solution: Complete the number of users numbered 21-30 in the Train file. The evaluation criterion is the comparison of predictions with actual quantities.
First load the files and packages
library(lubridate)library(randomForest)library(readr)setwd("E:")
data<-read_csv("train.csv")head(data)I encountered a pitfall here, using r language The default read.csv cannot read the correct file format, and it is even worse when it is replaced with xlsx. It turns into a strange number like 43045 all the time. I have tried as.Date before and it can be converted correctly, but this time because there are minutes and seconds, I can only use timestamp, but the result is not good.
Finally, I downloaded the "readr" package and used the read_csv statement to interpret it smoothly.
Because the test date is more complete than the train date, but the number of users is missing, train and test must be merged.
test$registered=0test$casual=0test$count=0
data<-rbind(train,test)
Extract time: You can use timestamp. The time here is relatively simple, it is the number of hours, so you can also directly intercept the string.
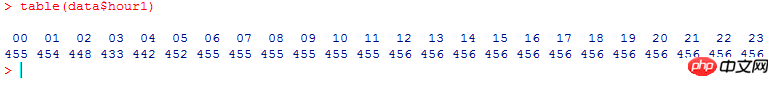
data$hour1<-substr(data$datetime,12,13)
table(data$hour1)
Count the total usage per hour, it is like this (why is it so neat):
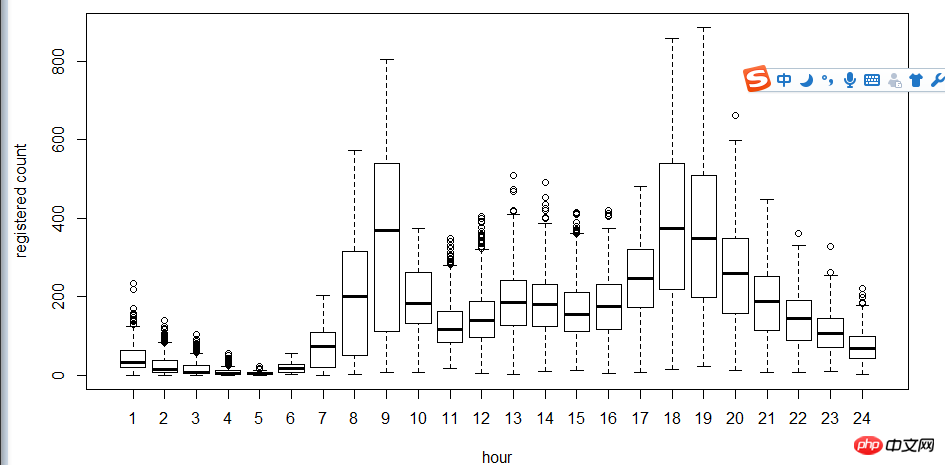
The next step is to use the box plot to look at the relationship between users, time, and days of the week. Why use box plots instead of hist histograms? Because box plots have discrete point expressions, so logarithms are used to find fit
. As can be seen from the figure, in terms of time, the usage of registered users and non-registered users Time makes a big difference.
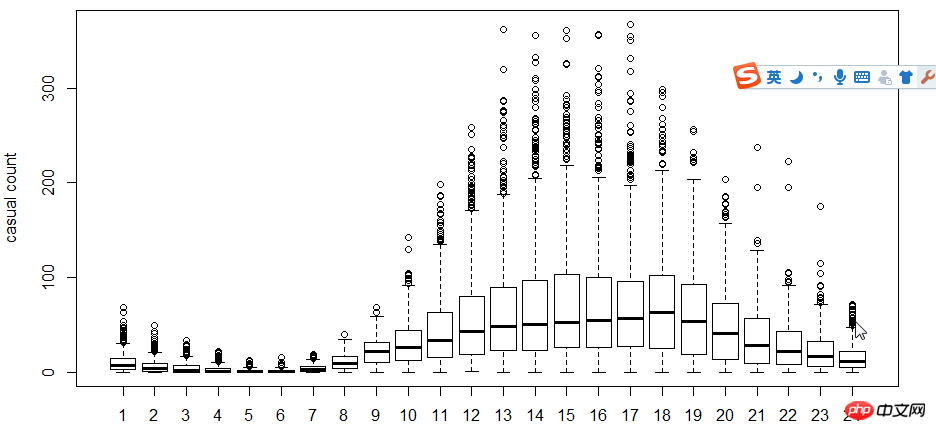
##5-hour-casual.png
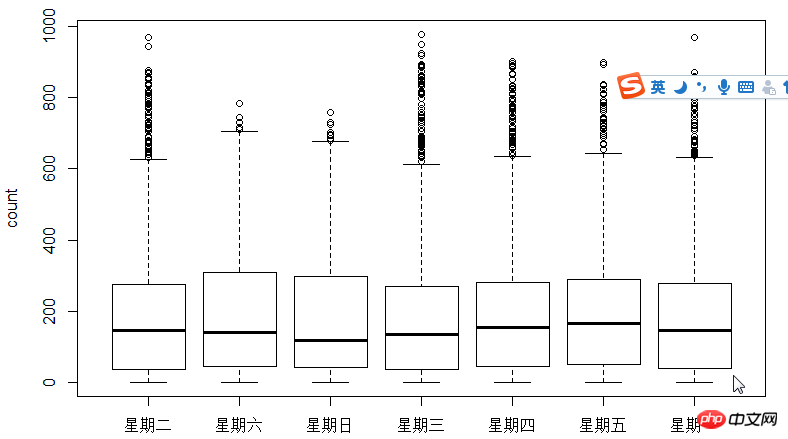
4-boxplot-day.png
Correlation coefficient: a linear association measure between variables, testing the degree of correlation between different data.It can be seen from the calculation results that the number of users is negatively correlated with the wind speed, which has a greater impact than the temperature.Value range [-1, 1], the closer to 0, the less relevant.
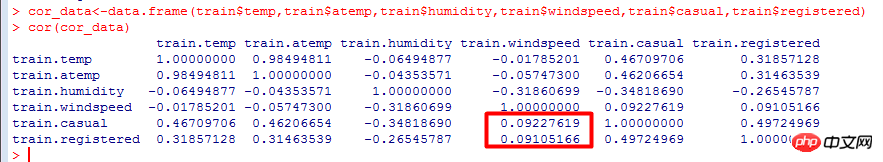
cor.png
The decision tree model is a simple and easy-to-use non-parametric classifier. It does not require any a priori assumptions about the data, is fast in calculation, easy to interpret the results, and is robust against noisy data and missing data.Make Decision tree of registered users and hours,The basic calculation steps of the decision tree model are as follows: first select one of the n independent variables, find the best split point, and divide the data into two groups. For the grouped data, repeat the above steps until a certain condition is met.
There are three important issues that need to be solved in decision tree modeling:
How to choose the independent variables
How to choose the split point
Determine the conditions for stopping the division
train$hour1<-as.integer(train$hour1)d<-rpart(registered~hour1,data=train)rpart.plot(d)
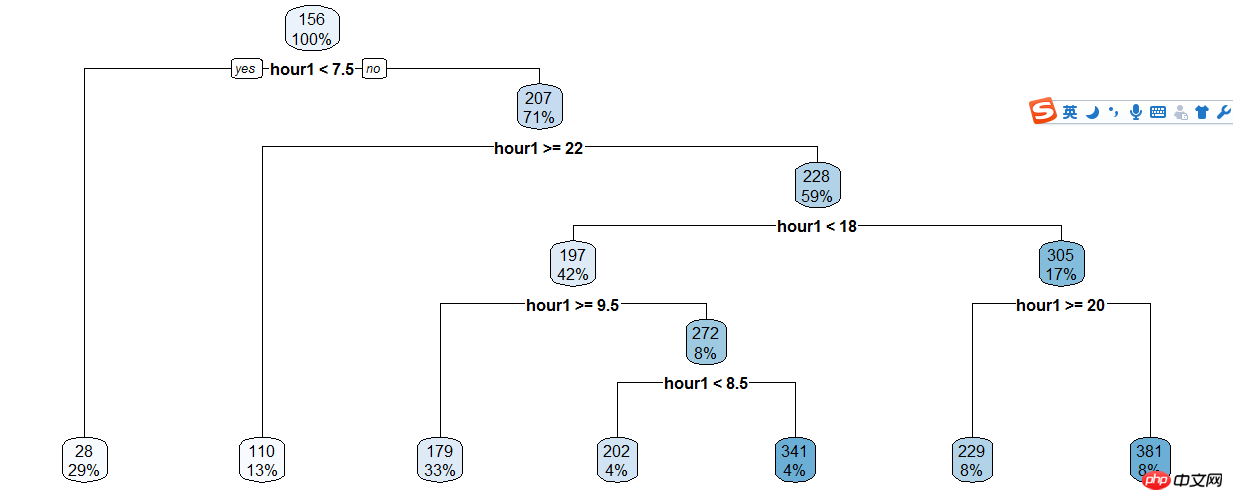
3-raprt-hour1.png
Then the result is based on the decision tree Manual classification, so the code is still full...
train$hour1<-as.integer(train$hour1)data$dp_reg=0data$dp_reg[data$hour1<7.5]=1data$dp_reg[data$hour1>=22]=2data$dp_reg[data$hour1>=9.5 & data$hour1<18]=3data$dp_reg[data$hour1>=7.5 & data$hour1<18]=4data$dp_reg[data$hour1>=8.5 & data$hour1<18]=5data$dp_reg[data$hour1>=20 & data$hour1<20]=6data$dp_reg[data$hour1>=18 & data$hour1<20]=7
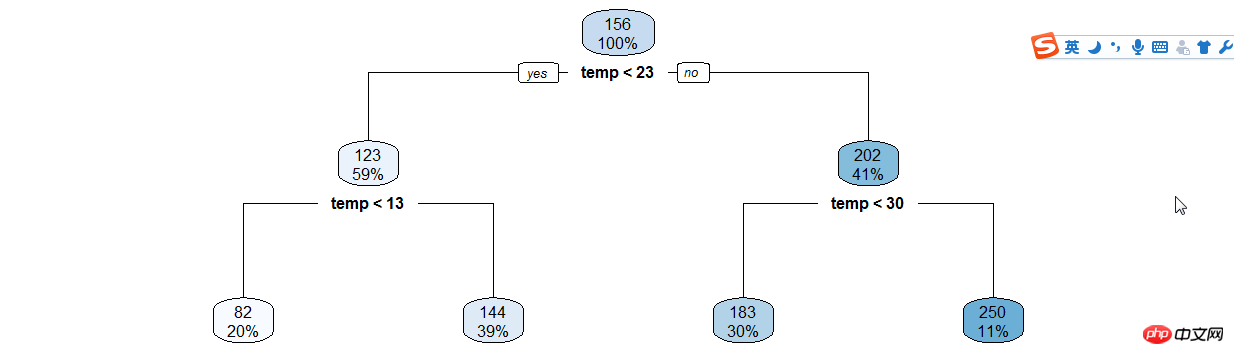 3-raprt-temp.png
年份月份,周末假日等手动分类
data$year_part=0data$month<-month(data$datatime)data$year_part[data$year=='2011']=1data$year_part[data$year=='2011' & data$month>3]=2data$year_part[data$year=='2011' & data$month>6]=3data$year_part[data$year=='2011' & data$month>9]=4
data$day_type=""data$day_type[data$holiday==0 & data$workingday==0]="weekend"data$day_type[data$holiday==1]="holiday"data$day_type[data$holiday==0 & data$workingday==1]="working day"data$weekend=0data$weekend[data$day=="Sunday"|data$day=="Saturday"]=1
接下来用随机森林语句预测
在机器学习中,随机森林是一个包含多个决策树的分类器, 并且其输出的类别是由个别树输出的类别的众数而定。
随机森林中的子树的每一个分裂过程并未用到所有的待选特征,而是从所有的待选特征中随机选取一定的特征,再在其中选取最优的特征。这样决策树都能够彼此不同,提升系统的多样性,从而提升分类性能。
ntree指定随机森林所包含的决策树数目,默认为500,通常在性能允许的情况下越大越好;
mtry指定节点中用于二叉树的变量个数,默认情况下数据集变量个数的二次方根(分类模型)或三分之一(预测模型)。一般是需要进行人为的逐次挑选,确定最佳的m值—摘自datacruiser笔记。这里我主要学习,所以虽然有10000多数据集,但也只定了500。就这500我的小电脑也跑了半天。
train<-dataset.seed(1234)
train$logreg<-log(train$registered+1)test$logcas<-log(train$casual+1)

fit1<-randomForest(logreg~hour1+workingday+day+holiday+day_type+temp_reg+humidity+atemp+windspeed+season+weather+dp_reg+weekend+year+year_part,train,importance=TRUE,ntree=250)

pred1<-predict(fit1,train)
train$logreg<-pred1
这里不知道怎么回事,我的day和day_part加进去就报错,只有删掉这两个变量计算,还要研究修补。
然后用exp函数还原
train$registered<-exp(train$logreg)-1
train$casual<-exp(train$logcas)-1
train$count<-test$casual+train$registered
最后把20日后的日期截出来,写入新的csv文件上传。
train2<-train[as.integer(day(data$datetime))>=20,]submit_final<-data.frame(datetime=test$datetime,count=test$count)write.csv(submit_final,"submit_final.csv",row.names=F)
大功告成!
github代码加群
原来的示例是炼数成金网站的kaggle课程第二节,基本按照视频的思路。因为课程没有源代码,所以要自己修补运行完整。历时两三天总算把这个功课做完了。下面要修正的有:
好好理解三个知识点(lubridate包/POSIXlt,log线性,决策树和随机森林);
用WOE和IV代替cor函数分析相关关系;
用其他图形展现的手段分析
随机树变量重新测试学习过程中遇到什么问题或者想获取学习资源的话,欢迎加入学习交流群
626062078,我们一起学Python!
完成了一个“浩大完整”的数据分析,还是很有成就感的!
The above is the detailed content of Detailed explanation of big data processing in Python. For more information, please follow other related articles on the PHP Chinese website!

Hot AI Tools

Undresser.AI Undress
AI-powered app for creating realistic nude photos

AI Clothes Remover
Online AI tool for removing clothes from photos.

Undress AI Tool
Undress images for free

Clothoff.io
AI clothes remover

AI Hentai Generator
Generate AI Hentai for free.

Hot Article
Hot Tools

Notepad++7.3.1
Easy-to-use and free code editor

SublimeText3 Chinese version
Chinese version, very easy to use

Zend Studio 13.0.1
Powerful PHP integrated development environment

Dreamweaver CS6
Visual web development tools

SublimeText3 Mac version
God-level code editing software (SublimeText3)
Hot Topics
 1386
1386
 52
52

 PHP and Python: Code Examples and Comparison
Apr 15, 2025 am 12:07 AM
PHP and Python: Code Examples and Comparison
Apr 15, 2025 am 12:07 AM
PHP and Python have their own advantages and disadvantages, and the choice depends on project needs and personal preferences. 1.PHP is suitable for rapid development and maintenance of large-scale web applications. 2. Python dominates the field of data science and machine learning.
 Python vs. JavaScript: Community, Libraries, and Resources
Apr 15, 2025 am 12:16 AM
Python vs. JavaScript: Community, Libraries, and Resources
Apr 15, 2025 am 12:16 AM
Python and JavaScript have their own advantages and disadvantages in terms of community, libraries and resources. 1) The Python community is friendly and suitable for beginners, but the front-end development resources are not as rich as JavaScript. 2) Python is powerful in data science and machine learning libraries, while JavaScript is better in front-end development libraries and frameworks. 3) Both have rich learning resources, but Python is suitable for starting with official documents, while JavaScript is better with MDNWebDocs. The choice should be based on project needs and personal interests.
 Detailed explanation of docker principle
Apr 14, 2025 pm 11:57 PM
Detailed explanation of docker principle
Apr 14, 2025 pm 11:57 PM
Docker uses Linux kernel features to provide an efficient and isolated application running environment. Its working principle is as follows: 1. The mirror is used as a read-only template, which contains everything you need to run the application; 2. The Union File System (UnionFS) stacks multiple file systems, only storing the differences, saving space and speeding up; 3. The daemon manages the mirrors and containers, and the client uses them for interaction; 4. Namespaces and cgroups implement container isolation and resource limitations; 5. Multiple network modes support container interconnection. Only by understanding these core concepts can you better utilize Docker.
 How to run programs in terminal vscode
Apr 15, 2025 pm 06:42 PM
How to run programs in terminal vscode
Apr 15, 2025 pm 06:42 PM
In VS Code, you can run the program in the terminal through the following steps: Prepare the code and open the integrated terminal to ensure that the code directory is consistent with the terminal working directory. Select the run command according to the programming language (such as Python's python your_file_name.py) to check whether it runs successfully and resolve errors. Use the debugger to improve debugging efficiency.
 Can visual studio code be used in python
Apr 15, 2025 pm 08:18 PM
Can visual studio code be used in python
Apr 15, 2025 pm 08:18 PM
VS Code can be used to write Python and provides many features that make it an ideal tool for developing Python applications. It allows users to: install Python extensions to get functions such as code completion, syntax highlighting, and debugging. Use the debugger to track code step by step, find and fix errors. Integrate Git for version control. Use code formatting tools to maintain code consistency. Use the Linting tool to spot potential problems ahead of time.
 Python: Automation, Scripting, and Task Management
Apr 16, 2025 am 12:14 AM
Python: Automation, Scripting, and Task Management
Apr 16, 2025 am 12:14 AM
Python excels in automation, scripting, and task management. 1) Automation: File backup is realized through standard libraries such as os and shutil. 2) Script writing: Use the psutil library to monitor system resources. 3) Task management: Use the schedule library to schedule tasks. Python's ease of use and rich library support makes it the preferred tool in these areas.
 Can vs code run in Windows 8
Apr 15, 2025 pm 07:24 PM
Can vs code run in Windows 8
Apr 15, 2025 pm 07:24 PM
VS Code can run on Windows 8, but the experience may not be great. First make sure the system has been updated to the latest patch, then download the VS Code installation package that matches the system architecture and install it as prompted. After installation, be aware that some extensions may be incompatible with Windows 8 and need to look for alternative extensions or use newer Windows systems in a virtual machine. Install the necessary extensions to check whether they work properly. Although VS Code is feasible on Windows 8, it is recommended to upgrade to a newer Windows system for a better development experience and security.
 Is the vscode extension malicious?
Apr 15, 2025 pm 07:57 PM
Is the vscode extension malicious?
Apr 15, 2025 pm 07:57 PM
VS Code extensions pose malicious risks, such as hiding malicious code, exploiting vulnerabilities, and masturbating as legitimate extensions. Methods to identify malicious extensions include: checking publishers, reading comments, checking code, and installing with caution. Security measures also include: security awareness, good habits, regular updates and antivirus software.
