Detailed explanation of using Apache's ab tool example
ab command principle
Apache's ab command simulates multi-threaded concurrent requests to test server load pressure. It can also test the pressure of other web servers such as nginx, lighthttp, IIS, etc.
The ab tool that comes with Apache (the PHP environment used is the WAMP integrated environment, the ab tool is located in D:\wamp\bin\apache\Apache2.2.21\bin) is very easy to use. The ab command has very low requirements on the computer that issues the load. It will not occupy a lot of CPU or memory, but it will cause a huge load to the target server. Therefore, it is a necessary medicine for some DDOS attacks. Suitable for all. You must also be careful when using it yourself. Otherwise, too much load is applied at once, causing the target server to crash due to running out of memory and having to hard restart, which is not worth the loss.
In the case of insufficient bandwidth, it is best to test on the local machine. It is recommended to use another or multiple servers on the intranet to test through the intranet. The data obtained in this way will be much more accurate. . Remote stress testing of web servers often yields unsatisfactory results (due to excessive network latency or insufficient bandwidth)
Download and install:
;O=A
Find httpd- 2.2.21-win32-x86-no_ssl.msi
Parameter documentation:
Run:
Under Windows system, open the cmd command line window and navigate to the bin directory of the apache installation directory
cd C:\Program Files (x86)\Apache Software Foundation\Apache2.2\bin
Type the command:
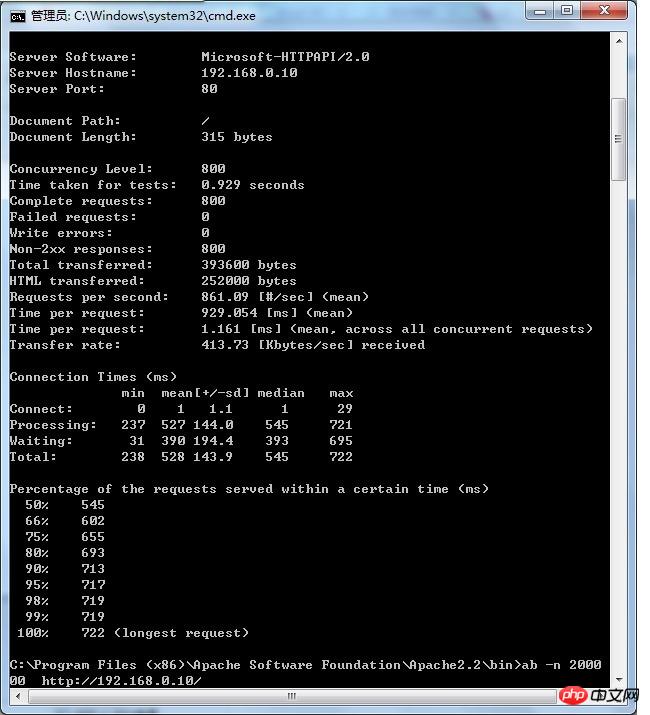
ab -n 800 -c 800 http://192.168.0.10/
(-n issues 800 requests, -c simulates 800 concurrency, equivalent to 800 people accessing at the same time, followed by the test url)
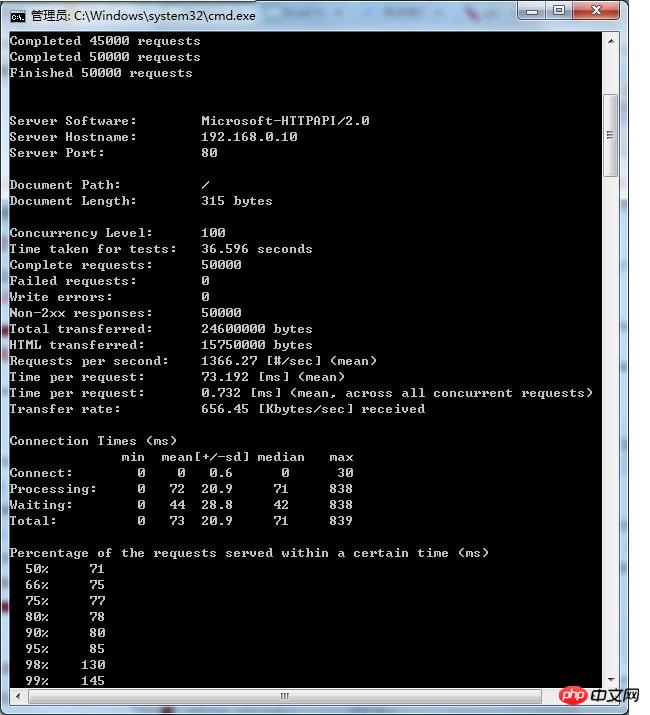
ab -t 60 -c 100 http://192.168.0.10/
Send requests within 60 seconds, 100 requests at a time.
//If you need to bring parameters in the url, do this
ab -t 60 -c 100 -T "text/plain" -p p.txt http://192.168.0.10/hello. html
p.txt is in the same directory as ab.exe
p.txt. You can write parameters in it, such as p=wdp&fq=78


Explanation of result parameters:
This is ApacheBench, Version 2.3
Copyright 1996 Adam Twiss, Zeus Technology Ltd,
Licenseed to The Apache Software Foundation,
Benchmarking 192.168.0.10 (be patient)
Completed 100 requests
Completed 200 requests
Completed 300 requests
Completed 400 requests
Completed 500 requests
Completed 600 requests
Completed 700 requests
Completed 800 requests
Finished 800 requests
Server Software: Microsoft-HTTPAPI/2.0 Represents the web server being tested Software name
Server Hostname: 192.168.0.10 Represents the requested URL host name
Server Port: 80 Represents the tested Web server software Listening port
Document Path: Root absolute path. Through the suffix name of this file, we can generally understand the type of the request
DOCUMENT LENGTH: 315 bytes.
Concurrency Level: 800 represents the number of concurrent users. This is one of the parameters we set. ## FAILED Requests: 0 Failure Requests
Write Errs: 0
Non-2xx Responses: 800
Total Transferred: 393600 bytes Total Transmission
HTML Transferred: 252000 bytes HTML content Transmission volume
Requests per second: 875.22 [#/sec] (mean) Throughput - number of requests per second
Time per request: 914.052 [ms] (mean) The time it takes for the server to receive a request and respond to the page
Time per request: 1.143 [ms] (mean, across all concurrent requests) The average time consumed by each concurrent request
Transfer rate: 420.52 [Kbytes/sec] received The average traffic on the network per second, which can help to rule out whether there is The problem of prolonged response time caused by excessive network traffic
Breakdown of time spent on the network:
Connect: 0 1 0.5 1 3
Processing: 245 534 125.2 570 682
Waiting: 11 386 189.1 409 669
Total: 246 535 125.0 571 684
Response status of all requests in the entire scenario. In the scenario, each request has a response time
50% of the user response time is less than 571 milliseconds
The maximum response time is less than 684 milliseconds
Percentage of the requests served within a certain time (ms)
50% 571
66% 627
75% 646
80% 652
90% 666
95% 677
98% 681
99% 682
100% 684 (longest request)
This part of the data is used to describe the distribution of each request processing time. For example, in the above test, 80% of the request processing time None exceed 6ms. This processing time refers to the previous Time per request, that is, the average processing time of each request for a single user.
The above is the detailed content of Detailed explanation of using Apache's ab tool example. For more information, please follow other related articles on the PHP Chinese website!

Hot AI Tools

Undresser.AI Undress
AI-powered app for creating realistic nude photos

AI Clothes Remover
Online AI tool for removing clothes from photos.

Undress AI Tool
Undress images for free

Clothoff.io
AI clothes remover

AI Hentai Generator
Generate AI Hentai for free.

Hot Article

Hot Tools

Notepad++7.3.1
Easy-to-use and free code editor

SublimeText3 Chinese version
Chinese version, very easy to use

Zend Studio 13.0.1
Powerful PHP integrated development environment

Dreamweaver CS6
Visual web development tools

SublimeText3 Mac version
God-level code editing software (SublimeText3)

Hot Topics
 PHP Framework Performance Comparison: The Ultimate Showdown of Speed vs. Efficiency
Apr 30, 2024 pm 12:27 PM
According to benchmarks, Laravel excels in page loading speed and database queries, while CodeIgniter excels in data processing. When choosing a PHP framework, you should consider application size, traffic patterns, and development team skills.
 How to conduct concurrency testing and debugging in Java concurrent programming?
May 09, 2024 am 09:33 AM
Concurrency testing and debugging Concurrency testing and debugging in Java concurrent programming are crucial and the following techniques are available: Concurrency testing: Unit testing: Isolate and test a single concurrent task. Integration testing: testing the interaction between multiple concurrent tasks. Load testing: Evaluate an application's performance and scalability under heavy load. Concurrency Debugging: Breakpoints: Pause thread execution and inspect variables or execute code. Logging: Record thread events and status. Stack trace: Identify the source of the exception. Visualization tools: Monitor thread activity and resource usage.
 How to add a server in eclipse
May 05, 2024 pm 07:27 PM
To add a server to Eclipse, follow these steps: Create a server runtime environment Configure the server Create a server instance Select the server runtime environment Configure the server instance Start the server deployment project
 The evasive module protects your website from application layer DOS attacks
Apr 30, 2024 pm 05:34 PM
There are a variety of attack methods that can take a website offline, and the more complex methods involve technical knowledge of databases and programming. A simpler method is called a "DenialOfService" (DOS) attack. The name of this attack method comes from its intention: to cause normal service requests from ordinary customers or website visitors to be denied. Generally speaking, there are two forms of DOS attacks: the third and fourth layers of the OSI model, that is, the network layer attack. The seventh layer of the OSI model, that is, the application layer attack. The first type of DOS attack - the network layer, occurs when a large number of of junk traffic flows to the web server. When spam traffic exceeds the network's ability to handle it, the website goes down. The second type of DOS attack is at the application layer and uses combined
 Application of algorithms in the construction of 58 portrait platform
May 09, 2024 am 09:01 AM
1. Background of the Construction of 58 Portraits Platform First of all, I would like to share with you the background of the construction of the 58 Portrait Platform. 1. The traditional thinking of the traditional profiling platform is no longer enough. Building a user profiling platform relies on data warehouse modeling capabilities to integrate data from multiple business lines to build accurate user portraits; it also requires data mining to understand user behavior, interests and needs, and provide algorithms. side capabilities; finally, it also needs to have data platform capabilities to efficiently store, query and share user profile data and provide profile services. The main difference between a self-built business profiling platform and a middle-office profiling platform is that the self-built profiling platform serves a single business line and can be customized on demand; the mid-office platform serves multiple business lines, has complex modeling, and provides more general capabilities. 2.58 User portraits of the background of Zhongtai portrait construction
 How to deploy and maintain a website using PHP
May 03, 2024 am 08:54 AM
To successfully deploy and maintain a PHP website, you need to perform the following steps: Select a web server (such as Apache or Nginx) Install PHP Create a database and connect PHP Upload code to the server Set up domain name and DNS Monitoring website maintenance steps include updating PHP and web servers, and backing up the website , monitor error logs and update content.
 How to implement PHP security best practices
May 05, 2024 am 10:51 AM
How to Implement PHP Security Best Practices PHP is one of the most popular backend web programming languages used for creating dynamic and interactive websites. However, PHP code can be vulnerable to various security vulnerabilities. Implementing security best practices is critical to protecting your web applications from these threats. Input validation Input validation is a critical first step in validating user input and preventing malicious input such as SQL injection. PHP provides a variety of input validation functions, such as filter_var() and preg_match(). Example: $username=filter_var($_POST['username'],FILTER_SANIT
 How to leverage Kubernetes Operator simplifiy PHP cloud deployment?
May 06, 2024 pm 04:51 PM
KubernetesOperator simplifies PHP cloud deployment by following these steps: Install PHPOperator to interact with the Kubernetes cluster. Deploy the PHP application, declare the image and port. Manage the application using commands such as getting, describing, and viewing logs.


